Immigrants from Switzerland vs French Canadian Unemployment Among Ages 25 to 29 years
COMPARE
Immigrants from Switzerland
French Canadian
Unemployment Among Ages 25 to 29 years
Unemployment Among Ages 25 to 29 years Comparison
Immigrants from Switzerland
French Canadians
6.3%
UNEMPLOYMENT AMONG AGES 25 TO 29 YEARS
96.0/ 100
METRIC RATING
79th/ 347
METRIC RANK
7.0%
UNEMPLOYMENT AMONG AGES 25 TO 29 YEARS
2.4/ 100
METRIC RATING
234th/ 347
METRIC RANK
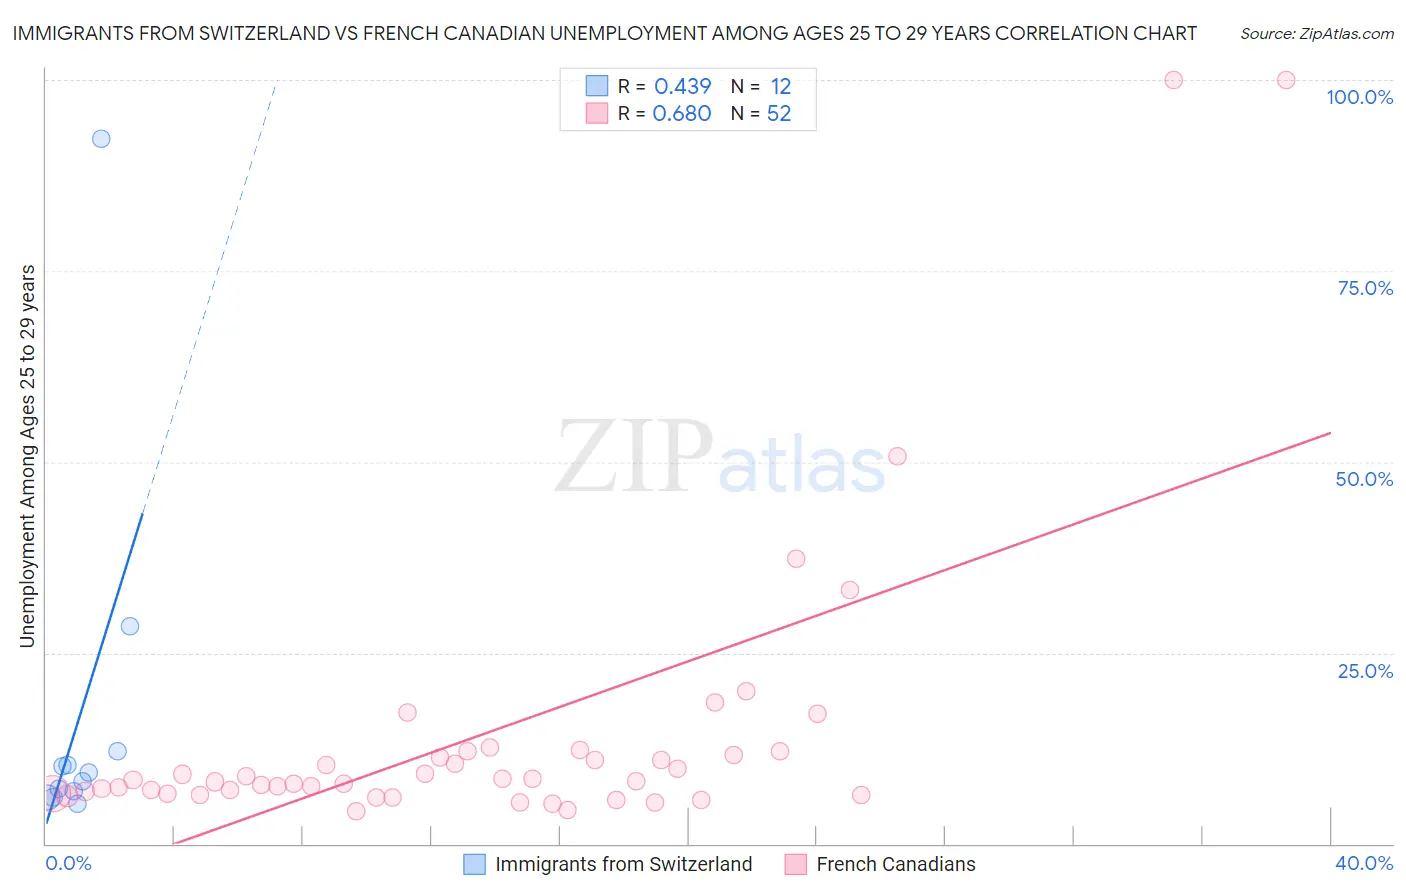
Immigrants from Switzerland vs French Canadian Unemployment Among Ages 25 to 29 years Correlation Chart
The statistical analysis conducted on geographies consisting of 144,055,678 people shows a moderate positive correlation between the proportion of Immigrants from Switzerland and unemployment rate among population between the ages 25 and 29 in the United States with a correlation coefficient (R) of 0.439 and weighted average of 6.3%. Similarly, the statistical analysis conducted on geographies consisting of 459,076,360 people shows a significant positive correlation between the proportion of French Canadians and unemployment rate among population between the ages 25 and 29 in the United States with a correlation coefficient (R) of 0.680 and weighted average of 7.0%, a difference of 11.2%.
Unemployment Among Ages 25 to 29 years Correlation Summary
| Measurement | Immigrants from Switzerland | French Canadian |
| Minimum | 5.3% | 4.3% |
| Maximum | 92.3% | 100.0% |
| Range | 87.0% | 95.7% |
| Mean | 16.9% | 14.3% |
| Median | 8.7% | 8.3% |
| Interquartile 25% (IQ1) | 6.5% | 6.6% |
| Interquartile 75% (IQ3) | 11.2% | 11.9% |
| Interquartile Range (IQR) | 4.7% | 5.3% |
| Standard Deviation (Sample) | 24.5% | 19.2% |
| Standard Deviation (Population) | 23.5% | 19.0% |
Similar Demographics by Unemployment Among Ages 25 to 29 years
Demographics Similar to Immigrants from Switzerland by Unemployment Among Ages 25 to 29 years
In terms of unemployment among ages 25 to 29 years, the demographic groups most similar to Immigrants from Switzerland are Immigrants from Romania (6.3%, a difference of 0.060%), Iranian (6.3%, a difference of 0.10%), Immigrants from Poland (6.3%, a difference of 0.14%), Asian (6.3%, a difference of 0.17%), and Icelander (6.3%, a difference of 0.27%).
| Demographics | Rating | Rank | Unemployment Among Ages 25 to 29 years |
| Scandinavians | 97.4 /100 | #72 | Exceptional 6.3% |
| Belgians | 97.0 /100 | #73 | Exceptional 6.3% |
| Carpatho Rusyns | 96.9 /100 | #74 | Exceptional 6.3% |
| Immigrants | Jordan | 96.8 /100 | #75 | Exceptional 6.3% |
| Immigrants | Korea | 96.7 /100 | #76 | Exceptional 6.3% |
| Icelanders | 96.6 /100 | #77 | Exceptional 6.3% |
| Asians | 96.4 /100 | #78 | Exceptional 6.3% |
| Immigrants | Switzerland | 96.0 /100 | #79 | Exceptional 6.3% |
| Immigrants | Romania | 95.9 /100 | #80 | Exceptional 6.3% |
| Iranians | 95.8 /100 | #81 | Exceptional 6.3% |
| Immigrants | Poland | 95.7 /100 | #82 | Exceptional 6.3% |
| Slovenes | 95.3 /100 | #83 | Exceptional 6.3% |
| Immigrants | Spain | 95.2 /100 | #84 | Exceptional 6.3% |
| Immigrants | Sweden | 95.1 /100 | #85 | Exceptional 6.3% |
| Immigrants | Asia | 94.9 /100 | #86 | Exceptional 6.3% |
Demographics Similar to French Canadians by Unemployment Among Ages 25 to 29 years
In terms of unemployment among ages 25 to 29 years, the demographic groups most similar to French Canadians are Immigrants from Honduras (7.0%, a difference of 0.020%), Panamanian (7.0%, a difference of 0.16%), Spanish American (7.0%, a difference of 0.21%), Cape Verdean (7.0%, a difference of 0.30%), and Central American (7.0%, a difference of 0.36%).
| Demographics | Rating | Rank | Unemployment Among Ages 25 to 29 years |
| Salvadorans | 4.4 /100 | #227 | Tragic 7.0% |
| Immigrants | Panama | 4.2 /100 | #228 | Tragic 7.0% |
| Bermudans | 3.8 /100 | #229 | Tragic 7.0% |
| Immigrants | El Salvador | 3.6 /100 | #230 | Tragic 7.0% |
| Central Americans | 3.0 /100 | #231 | Tragic 7.0% |
| Spanish Americans | 2.7 /100 | #232 | Tragic 7.0% |
| Immigrants | Honduras | 2.4 /100 | #233 | Tragic 7.0% |
| French Canadians | 2.4 /100 | #234 | Tragic 7.0% |
| Panamanians | 2.1 /100 | #235 | Tragic 7.0% |
| Cape Verdeans | 1.9 /100 | #236 | Tragic 7.0% |
| Puget Sound Salish | 1.8 /100 | #237 | Tragic 7.1% |
| Hondurans | 1.8 /100 | #238 | Tragic 7.1% |
| Potawatomi | 1.3 /100 | #239 | Tragic 7.1% |
| Native Hawaiians | 1.3 /100 | #240 | Tragic 7.1% |
| Immigrants | Sierra Leone | 1.3 /100 | #241 | Tragic 7.1% |