Immigrants from Spain vs Thai Male Unemployment
COMPARE
Immigrants from Spain
Thai
Male Unemployment
Male Unemployment Comparison
Immigrants from Spain
Thais
5.1%
MALE UNEMPLOYMENT
93.4/ 100
METRIC RATING
97th/ 347
METRIC RANK
4.6%
MALE UNEMPLOYMENT
100.0/ 100
METRIC RATING
9th/ 347
METRIC RANK
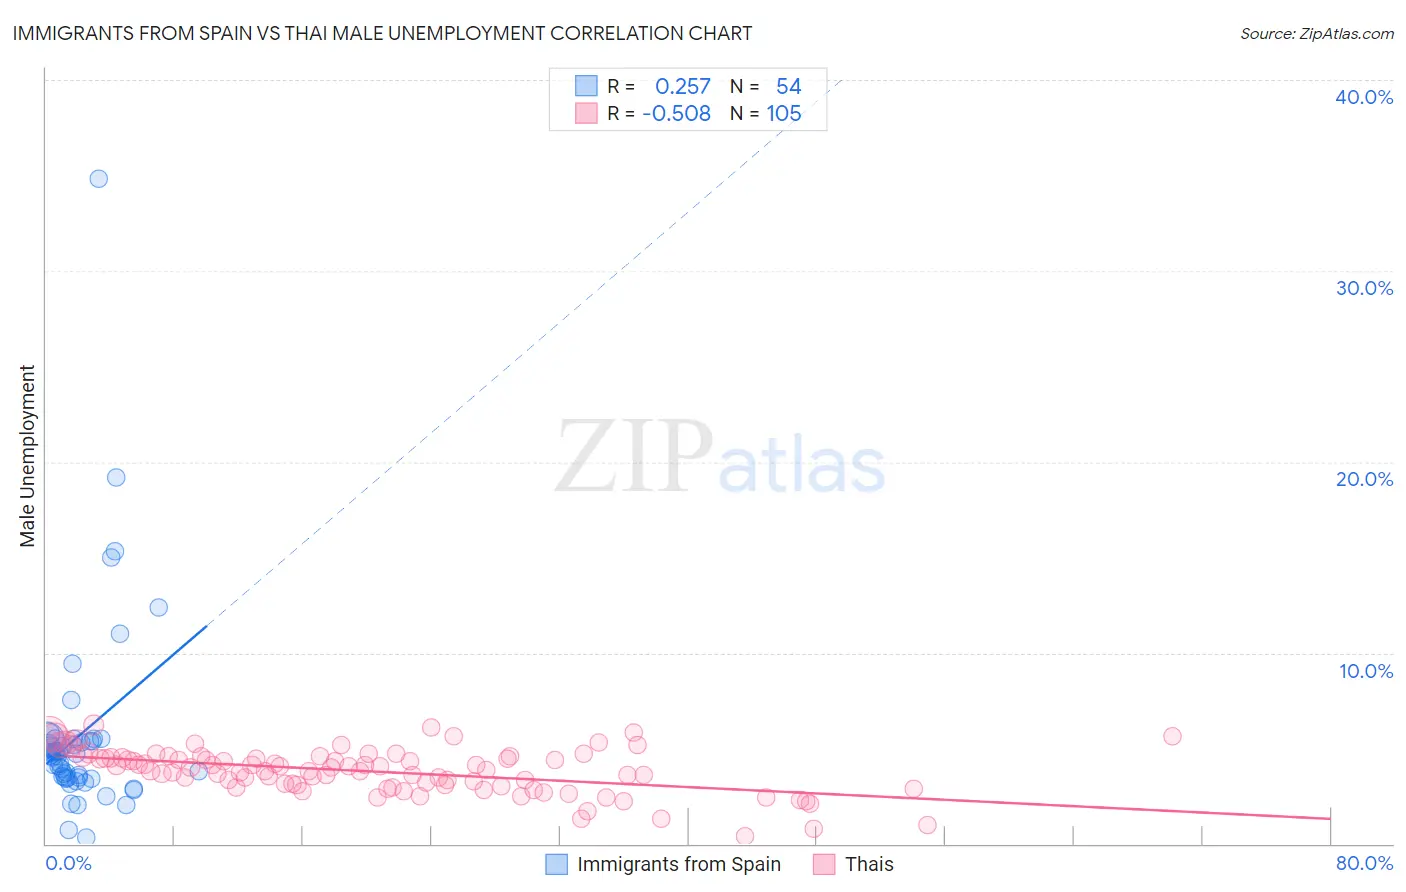
Immigrants from Spain vs Thai Male Unemployment Correlation Chart
The statistical analysis conducted on geographies consisting of 239,356,237 people shows a weak positive correlation between the proportion of Immigrants from Spain and unemployment rate among males in the United States with a correlation coefficient (R) of 0.257 and weighted average of 5.1%. Similarly, the statistical analysis conducted on geographies consisting of 473,148,308 people shows a substantial negative correlation between the proportion of Thais and unemployment rate among males in the United States with a correlation coefficient (R) of -0.508 and weighted average of 4.6%, a difference of 10.9%.
Male Unemployment Correlation Summary
| Measurement | Immigrants from Spain | Thai |
| Minimum | 0.30% | 0.40% |
| Maximum | 34.8% | 6.2% |
| Range | 34.5% | 5.8% |
| Mean | 5.7% | 3.8% |
| Median | 4.6% | 3.8% |
| Interquartile 25% (IQ1) | 3.5% | 3.0% |
| Interquartile 75% (IQ3) | 5.4% | 4.5% |
| Interquartile Range (IQR) | 1.9% | 1.5% |
| Standard Deviation (Sample) | 5.3% | 1.2% |
| Standard Deviation (Population) | 5.3% | 1.1% |
Similar Demographics by Male Unemployment
Demographics Similar to Immigrants from Spain by Male Unemployment
In terms of male unemployment, the demographic groups most similar to Immigrants from Spain are Immigrants from Kuwait (5.1%, a difference of 0.040%), Asian (5.1%, a difference of 0.070%), Italian (5.1%, a difference of 0.090%), Uruguayan (5.1%, a difference of 0.10%), and Russian (5.1%, a difference of 0.12%).
| Demographics | Rating | Rank | Male Unemployment |
| Okinawans | 94.7 /100 | #90 | Exceptional 5.1% |
| Immigrants | Turkey | 94.4 /100 | #91 | Exceptional 5.1% |
| Slavs | 94.2 /100 | #92 | Exceptional 5.1% |
| Immigrants | Serbia | 94.2 /100 | #93 | Exceptional 5.1% |
| Canadians | 94.1 /100 | #94 | Exceptional 5.1% |
| Italians | 93.8 /100 | #95 | Exceptional 5.1% |
| Asians | 93.7 /100 | #96 | Exceptional 5.1% |
| Immigrants | Spain | 93.4 /100 | #97 | Exceptional 5.1% |
| Immigrants | Kuwait | 93.3 /100 | #98 | Exceptional 5.1% |
| Uruguayans | 93.0 /100 | #99 | Exceptional 5.1% |
| Russians | 92.9 /100 | #100 | Exceptional 5.1% |
| German Russians | 92.7 /100 | #101 | Exceptional 5.1% |
| Immigrants | France | 92.7 /100 | #102 | Exceptional 5.1% |
| Immigrants | Jordan | 91.9 /100 | #103 | Exceptional 5.1% |
| Immigrants | Chile | 91.8 /100 | #104 | Exceptional 5.1% |
Demographics Similar to Thais by Male Unemployment
In terms of male unemployment, the demographic groups most similar to Thais are Cuban (4.6%, a difference of 0.60%), Swedish (4.6%, a difference of 0.81%), Luxembourger (4.5%, a difference of 1.2%), Czech (4.5%, a difference of 1.5%), and Immigrants from Bolivia (4.7%, a difference of 1.5%).
| Demographics | Rating | Rank | Male Unemployment |
| Immigrants | Cuba | 100.0 /100 | #2 | Exceptional 4.4% |
| Norwegians | 100.0 /100 | #3 | Exceptional 4.4% |
| Immigrants | Venezuela | 100.0 /100 | #4 | Exceptional 4.4% |
| Danes | 100.0 /100 | #5 | Exceptional 4.5% |
| Venezuelans | 100.0 /100 | #6 | Exceptional 4.5% |
| Czechs | 100.0 /100 | #7 | Exceptional 4.5% |
| Luxembourgers | 100.0 /100 | #8 | Exceptional 4.5% |
| Thais | 100.0 /100 | #9 | Exceptional 4.6% |
| Cubans | 100.0 /100 | #10 | Exceptional 4.6% |
| Swedes | 100.0 /100 | #11 | Exceptional 4.6% |
| Immigrants | Bolivia | 100.0 /100 | #12 | Exceptional 4.7% |
| Bolivians | 100.0 /100 | #13 | Exceptional 4.7% |
| Germans | 100.0 /100 | #14 | Exceptional 4.7% |
| Scandinavians | 100.0 /100 | #15 | Exceptional 4.7% |
| Swiss | 99.9 /100 | #16 | Exceptional 4.7% |