Immigrants from Spain vs Native Hawaiian Male Unemployment
COMPARE
Immigrants from Spain
Native Hawaiian
Male Unemployment
Male Unemployment Comparison
Immigrants from Spain
Native Hawaiians
5.1%
MALE UNEMPLOYMENT
93.4/ 100
METRIC RATING
97th/ 347
METRIC RANK
5.6%
MALE UNEMPLOYMENT
1.1/ 100
METRIC RATING
238th/ 347
METRIC RANK
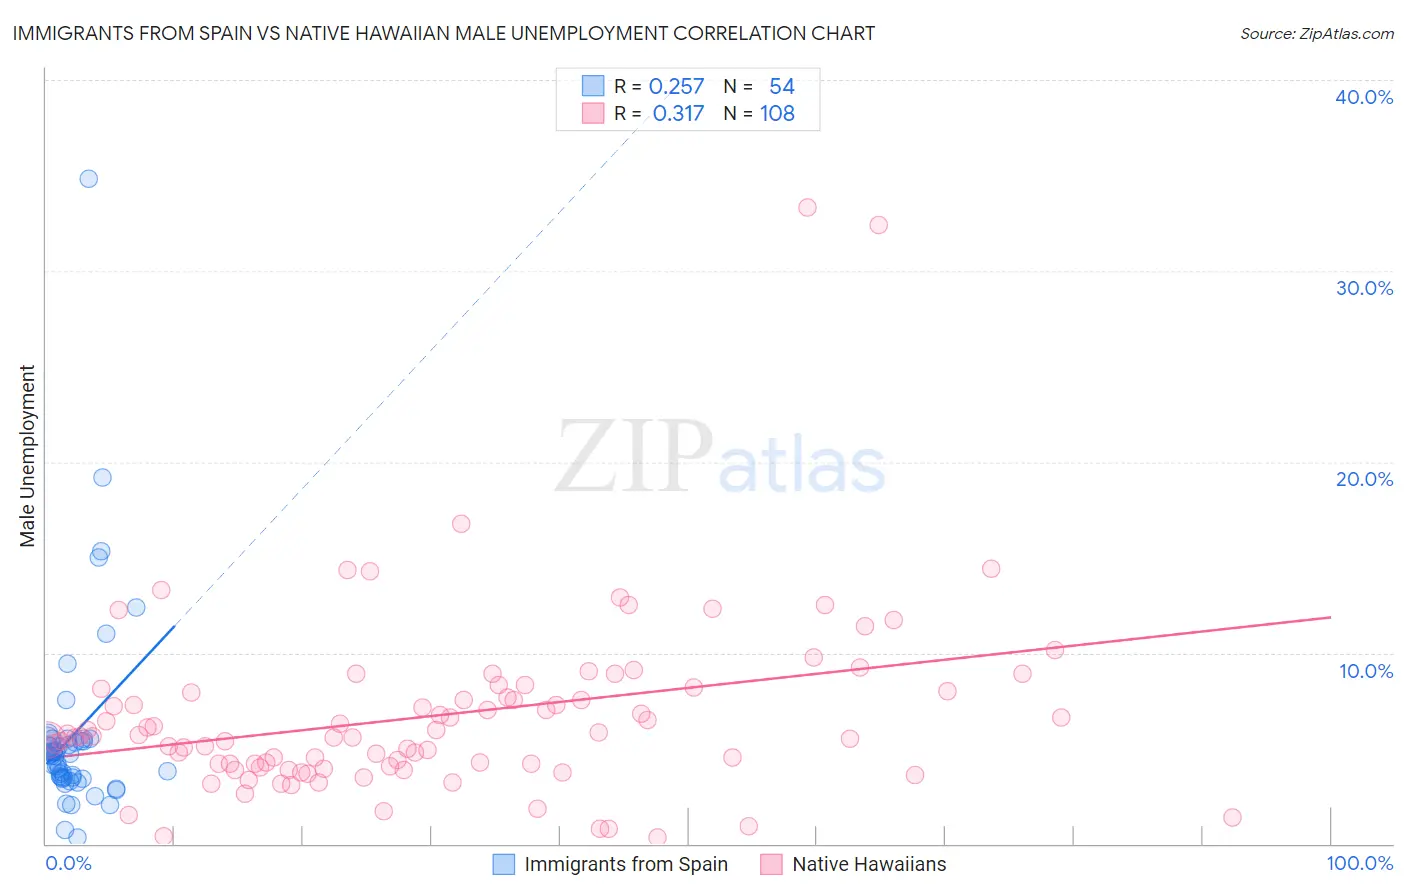
Immigrants from Spain vs Native Hawaiian Male Unemployment Correlation Chart
The statistical analysis conducted on geographies consisting of 239,356,237 people shows a weak positive correlation between the proportion of Immigrants from Spain and unemployment rate among males in the United States with a correlation coefficient (R) of 0.257 and weighted average of 5.1%. Similarly, the statistical analysis conducted on geographies consisting of 330,837,635 people shows a mild positive correlation between the proportion of Native Hawaiians and unemployment rate among males in the United States with a correlation coefficient (R) of 0.317 and weighted average of 5.6%, a difference of 10.9%.
Male Unemployment Correlation Summary
| Measurement | Immigrants from Spain | Native Hawaiian |
| Minimum | 0.30% | 0.30% |
| Maximum | 34.8% | 33.3% |
| Range | 34.5% | 33.0% |
| Mean | 5.7% | 6.7% |
| Median | 4.6% | 5.6% |
| Interquartile 25% (IQ1) | 3.5% | 4.1% |
| Interquartile 75% (IQ3) | 5.4% | 8.1% |
| Interquartile Range (IQR) | 1.9% | 4.0% |
| Standard Deviation (Sample) | 5.3% | 4.9% |
| Standard Deviation (Population) | 5.3% | 4.9% |
Similar Demographics by Male Unemployment
Demographics Similar to Immigrants from Spain by Male Unemployment
In terms of male unemployment, the demographic groups most similar to Immigrants from Spain are Immigrants from Kuwait (5.1%, a difference of 0.040%), Asian (5.1%, a difference of 0.070%), Italian (5.1%, a difference of 0.090%), Uruguayan (5.1%, a difference of 0.10%), and Russian (5.1%, a difference of 0.12%).
| Demographics | Rating | Rank | Male Unemployment |
| Okinawans | 94.7 /100 | #90 | Exceptional 5.1% |
| Immigrants | Turkey | 94.4 /100 | #91 | Exceptional 5.1% |
| Slavs | 94.2 /100 | #92 | Exceptional 5.1% |
| Immigrants | Serbia | 94.2 /100 | #93 | Exceptional 5.1% |
| Canadians | 94.1 /100 | #94 | Exceptional 5.1% |
| Italians | 93.8 /100 | #95 | Exceptional 5.1% |
| Asians | 93.7 /100 | #96 | Exceptional 5.1% |
| Immigrants | Spain | 93.4 /100 | #97 | Exceptional 5.1% |
| Immigrants | Kuwait | 93.3 /100 | #98 | Exceptional 5.1% |
| Uruguayans | 93.0 /100 | #99 | Exceptional 5.1% |
| Russians | 92.9 /100 | #100 | Exceptional 5.1% |
| German Russians | 92.7 /100 | #101 | Exceptional 5.1% |
| Immigrants | France | 92.7 /100 | #102 | Exceptional 5.1% |
| Immigrants | Jordan | 91.9 /100 | #103 | Exceptional 5.1% |
| Immigrants | Chile | 91.8 /100 | #104 | Exceptional 5.1% |
Demographics Similar to Native Hawaiians by Male Unemployment
In terms of male unemployment, the demographic groups most similar to Native Hawaiians are Immigrants from Guatemala (5.6%, a difference of 0.0%), Honduran (5.6%, a difference of 0.050%), Immigrants from Cameroon (5.6%, a difference of 0.070%), Salvadoran (5.7%, a difference of 0.12%), and Guatemalan (5.6%, a difference of 0.14%).
| Demographics | Rating | Rank | Male Unemployment |
| Choctaw | 1.6 /100 | #231 | Tragic 5.6% |
| Moroccans | 1.6 /100 | #232 | Tragic 5.6% |
| Somalis | 1.5 /100 | #233 | Tragic 5.6% |
| Immigrants | Somalia | 1.5 /100 | #234 | Tragic 5.6% |
| Immigrants | Honduras | 1.5 /100 | #235 | Tragic 5.6% |
| Guatemalans | 1.2 /100 | #236 | Tragic 5.6% |
| Hondurans | 1.1 /100 | #237 | Tragic 5.6% |
| Native Hawaiians | 1.1 /100 | #238 | Tragic 5.6% |
| Immigrants | Guatemala | 1.1 /100 | #239 | Tragic 5.6% |
| Immigrants | Cameroon | 1.0 /100 | #240 | Tragic 5.6% |
| Salvadorans | 1.0 /100 | #241 | Tragic 5.7% |
| Ottawa | 0.9 /100 | #242 | Tragic 5.7% |
| Bangladeshis | 0.8 /100 | #243 | Tragic 5.7% |
| Immigrants | El Salvador | 0.7 /100 | #244 | Tragic 5.7% |
| Yaqui | 0.7 /100 | #245 | Tragic 5.7% |