Argentinean vs Thai Male Unemployment
COMPARE
Argentinean
Thai
Male Unemployment
Male Unemployment Comparison
Argentineans
Thais
5.0%
MALE UNEMPLOYMENT
96.2/ 100
METRIC RATING
80th/ 347
METRIC RANK
4.6%
MALE UNEMPLOYMENT
100.0/ 100
METRIC RATING
9th/ 347
METRIC RANK
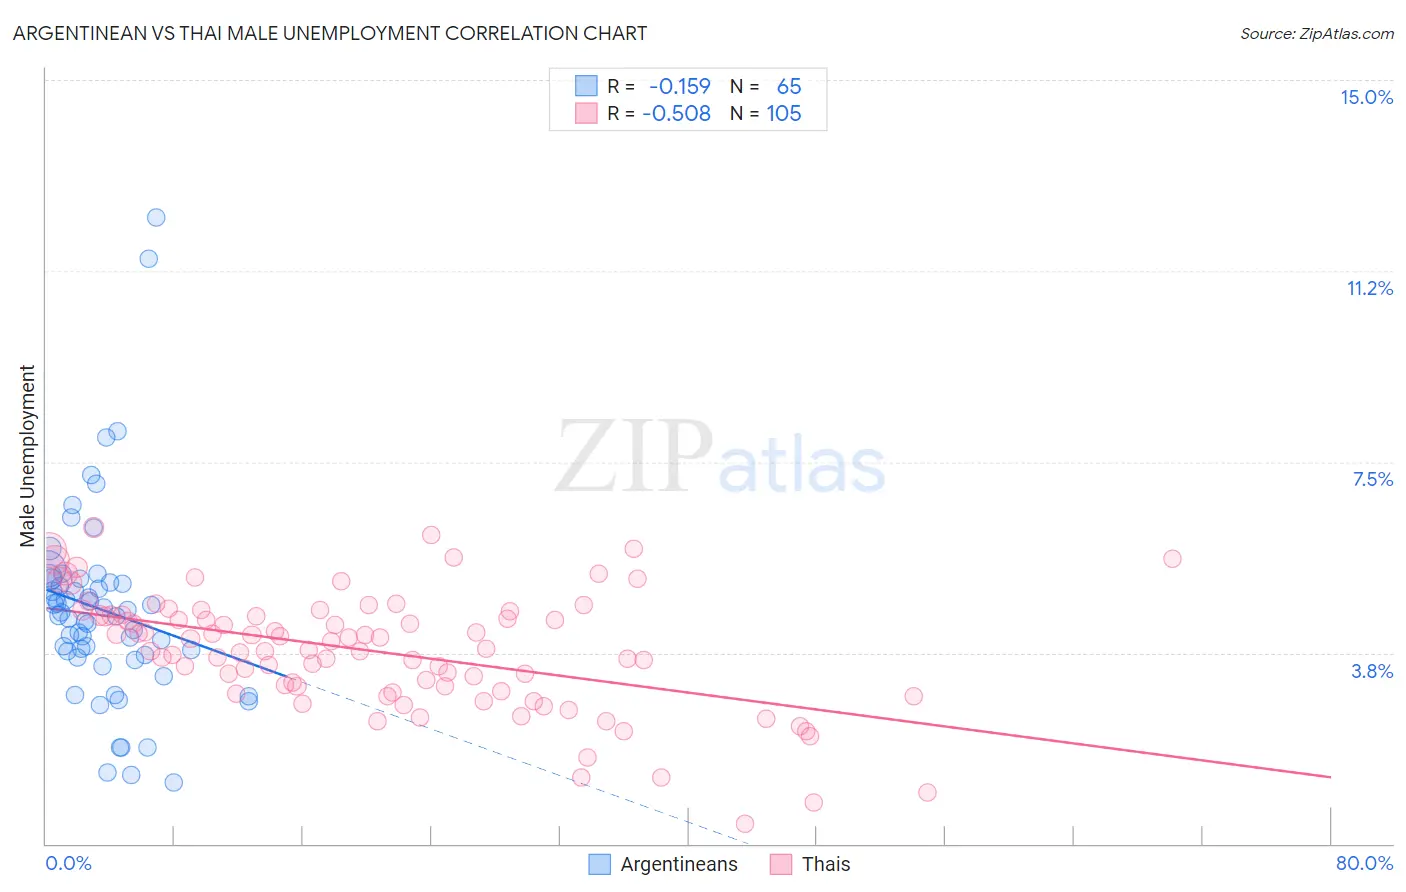
Argentinean vs Thai Male Unemployment Correlation Chart
The statistical analysis conducted on geographies consisting of 296,564,256 people shows a poor negative correlation between the proportion of Argentineans and unemployment rate among males in the United States with a correlation coefficient (R) of -0.159 and weighted average of 5.0%. Similarly, the statistical analysis conducted on geographies consisting of 473,148,308 people shows a substantial negative correlation between the proportion of Thais and unemployment rate among males in the United States with a correlation coefficient (R) of -0.508 and weighted average of 4.6%, a difference of 9.9%.
Male Unemployment Correlation Summary
| Measurement | Argentinean | Thai |
| Minimum | 1.2% | 0.40% |
| Maximum | 12.3% | 6.2% |
| Range | 11.1% | 5.8% |
| Mean | 4.6% | 3.8% |
| Median | 4.5% | 3.8% |
| Interquartile 25% (IQ1) | 3.7% | 3.0% |
| Interquartile 75% (IQ3) | 5.2% | 4.5% |
| Interquartile Range (IQR) | 1.5% | 1.5% |
| Standard Deviation (Sample) | 1.9% | 1.2% |
| Standard Deviation (Population) | 1.9% | 1.1% |
Similar Demographics by Male Unemployment
Demographics Similar to Argentineans by Male Unemployment
In terms of male unemployment, the demographic groups most similar to Argentineans are French (5.0%, a difference of 0.0%), Chilean (5.0%, a difference of 0.040%), South African (5.0%, a difference of 0.050%), Immigrants from Northern Europe (5.0%, a difference of 0.060%), and Iranian (5.0%, a difference of 0.080%).
| Demographics | Rating | Rank | Male Unemployment |
| Greeks | 97.0 /100 | #73 | Exceptional 5.0% |
| Immigrants | North America | 96.9 /100 | #74 | Exceptional 5.0% |
| Assyrians/Chaldeans/Syriacs | 96.9 /100 | #75 | Exceptional 5.0% |
| Immigrants | Sudan | 96.5 /100 | #76 | Exceptional 5.0% |
| Iranians | 96.4 /100 | #77 | Exceptional 5.0% |
| Immigrants | Northern Europe | 96.4 /100 | #78 | Exceptional 5.0% |
| South Africans | 96.4 /100 | #79 | Exceptional 5.0% |
| Argentineans | 96.2 /100 | #80 | Exceptional 5.0% |
| French | 96.2 /100 | #81 | Exceptional 5.0% |
| Chileans | 96.2 /100 | #82 | Exceptional 5.0% |
| Immigrants | Eritrea | 96.0 /100 | #83 | Exceptional 5.0% |
| Serbians | 95.7 /100 | #84 | Exceptional 5.1% |
| Immigrants | North Macedonia | 95.6 /100 | #85 | Exceptional 5.1% |
| Maltese | 95.5 /100 | #86 | Exceptional 5.1% |
| Immigrants | Romania | 95.4 /100 | #87 | Exceptional 5.1% |
Demographics Similar to Thais by Male Unemployment
In terms of male unemployment, the demographic groups most similar to Thais are Cuban (4.6%, a difference of 0.60%), Swedish (4.6%, a difference of 0.81%), Luxembourger (4.5%, a difference of 1.2%), Czech (4.5%, a difference of 1.5%), and Immigrants from Bolivia (4.7%, a difference of 1.5%).
| Demographics | Rating | Rank | Male Unemployment |
| Immigrants | Cuba | 100.0 /100 | #2 | Exceptional 4.4% |
| Norwegians | 100.0 /100 | #3 | Exceptional 4.4% |
| Immigrants | Venezuela | 100.0 /100 | #4 | Exceptional 4.4% |
| Danes | 100.0 /100 | #5 | Exceptional 4.5% |
| Venezuelans | 100.0 /100 | #6 | Exceptional 4.5% |
| Czechs | 100.0 /100 | #7 | Exceptional 4.5% |
| Luxembourgers | 100.0 /100 | #8 | Exceptional 4.5% |
| Thais | 100.0 /100 | #9 | Exceptional 4.6% |
| Cubans | 100.0 /100 | #10 | Exceptional 4.6% |
| Swedes | 100.0 /100 | #11 | Exceptional 4.6% |
| Immigrants | Bolivia | 100.0 /100 | #12 | Exceptional 4.7% |
| Bolivians | 100.0 /100 | #13 | Exceptional 4.7% |
| Germans | 100.0 /100 | #14 | Exceptional 4.7% |
| Scandinavians | 100.0 /100 | #15 | Exceptional 4.7% |
| Swiss | 99.9 /100 | #16 | Exceptional 4.7% |