Immigrants from Cambodia vs Thai Male Unemployment
COMPARE
Immigrants from Cambodia
Thai
Male Unemployment
Male Unemployment Comparison
Immigrants from Cambodia
Thais
5.6%
MALE UNEMPLOYMENT
1.8/ 100
METRIC RATING
226th/ 347
METRIC RANK
4.6%
MALE UNEMPLOYMENT
100.0/ 100
METRIC RATING
9th/ 347
METRIC RANK
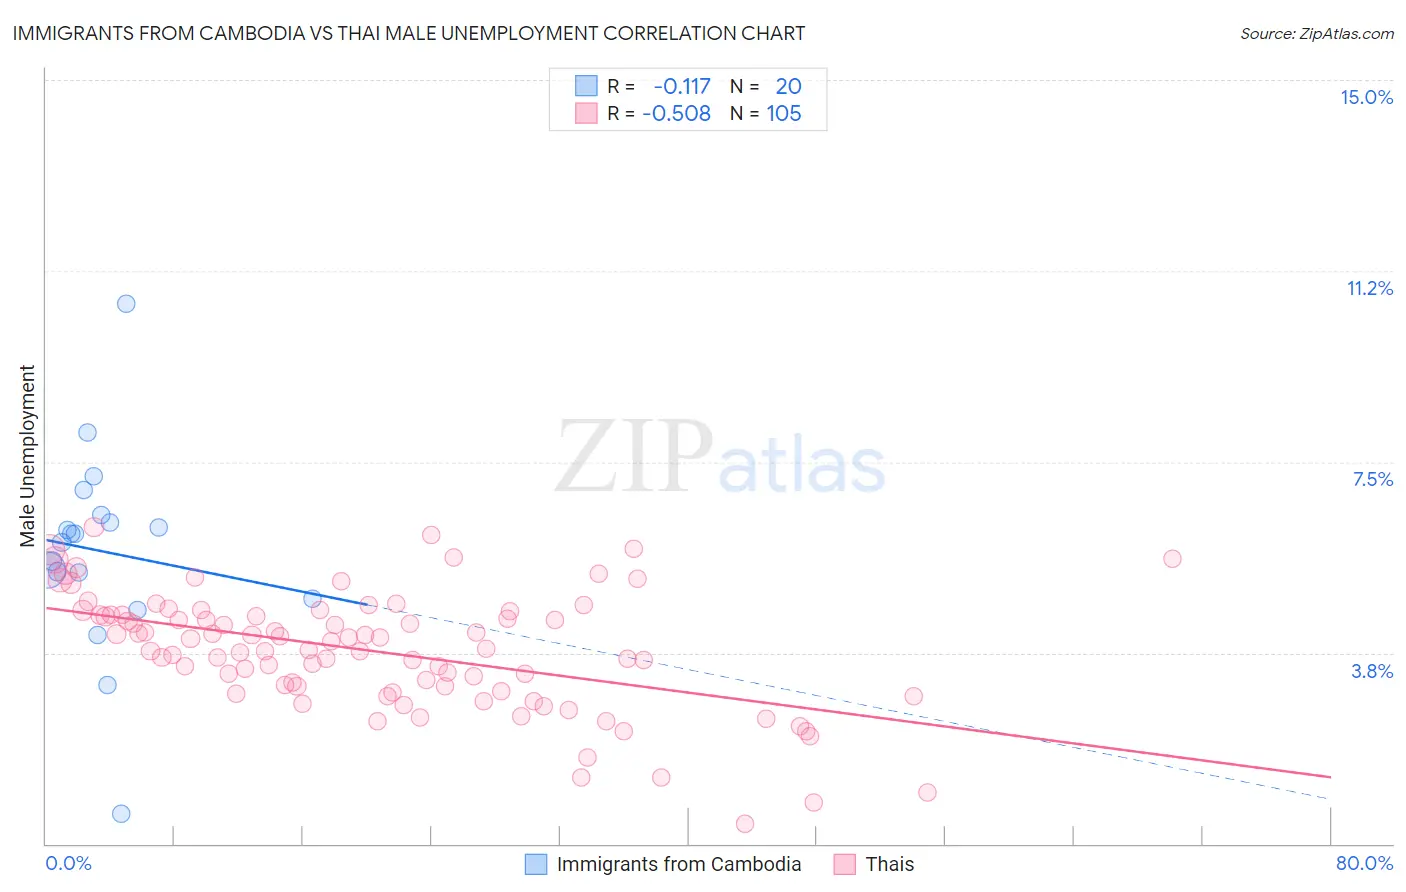
Immigrants from Cambodia vs Thai Male Unemployment Correlation Chart
The statistical analysis conducted on geographies consisting of 204,980,262 people shows a poor negative correlation between the proportion of Immigrants from Cambodia and unemployment rate among males in the United States with a correlation coefficient (R) of -0.117 and weighted average of 5.6%. Similarly, the statistical analysis conducted on geographies consisting of 473,148,308 people shows a substantial negative correlation between the proportion of Thais and unemployment rate among males in the United States with a correlation coefficient (R) of -0.508 and weighted average of 4.6%, a difference of 22.1%.
Male Unemployment Correlation Summary
| Measurement | Immigrants from Cambodia | Thai |
| Minimum | 0.60% | 0.40% |
| Maximum | 10.6% | 6.2% |
| Range | 10.0% | 5.8% |
| Mean | 5.7% | 3.8% |
| Median | 6.0% | 3.8% |
| Interquartile 25% (IQ1) | 5.1% | 3.0% |
| Interquartile 75% (IQ3) | 6.4% | 4.5% |
| Interquartile Range (IQR) | 1.3% | 1.5% |
| Standard Deviation (Sample) | 2.0% | 1.2% |
| Standard Deviation (Population) | 1.9% | 1.1% |
Similar Demographics by Male Unemployment
Demographics Similar to Immigrants from Cambodia by Male Unemployment
In terms of male unemployment, the demographic groups most similar to Immigrants from Cambodia are Immigrants from Panama (5.6%, a difference of 0.0%), Seminole (5.6%, a difference of 0.020%), Central American (5.6%, a difference of 0.030%), Immigrants from Africa (5.6%, a difference of 0.060%), and Panamanian (5.6%, a difference of 0.090%).
| Demographics | Rating | Rank | Male Unemployment |
| Immigrants | Western Asia | 3.5 /100 | #219 | Tragic 5.6% |
| Portuguese | 3.5 /100 | #220 | Tragic 5.6% |
| Soviet Union | 3.2 /100 | #221 | Tragic 5.6% |
| Immigrants | Micronesia | 2.9 /100 | #222 | Tragic 5.6% |
| Creek | 2.6 /100 | #223 | Tragic 5.6% |
| Cherokee | 2.4 /100 | #224 | Tragic 5.6% |
| Panamanians | 1.9 /100 | #225 | Tragic 5.6% |
| Immigrants | Cambodia | 1.8 /100 | #226 | Tragic 5.6% |
| Immigrants | Panama | 1.8 /100 | #227 | Tragic 5.6% |
| Seminole | 1.8 /100 | #228 | Tragic 5.6% |
| Central Americans | 1.8 /100 | #229 | Tragic 5.6% |
| Immigrants | Africa | 1.7 /100 | #230 | Tragic 5.6% |
| Choctaw | 1.6 /100 | #231 | Tragic 5.6% |
| Moroccans | 1.6 /100 | #232 | Tragic 5.6% |
| Somalis | 1.5 /100 | #233 | Tragic 5.6% |
Demographics Similar to Thais by Male Unemployment
In terms of male unemployment, the demographic groups most similar to Thais are Cuban (4.6%, a difference of 0.60%), Swedish (4.6%, a difference of 0.81%), Luxembourger (4.5%, a difference of 1.2%), Czech (4.5%, a difference of 1.5%), and Immigrants from Bolivia (4.7%, a difference of 1.5%).
| Demographics | Rating | Rank | Male Unemployment |
| Immigrants | Cuba | 100.0 /100 | #2 | Exceptional 4.4% |
| Norwegians | 100.0 /100 | #3 | Exceptional 4.4% |
| Immigrants | Venezuela | 100.0 /100 | #4 | Exceptional 4.4% |
| Danes | 100.0 /100 | #5 | Exceptional 4.5% |
| Venezuelans | 100.0 /100 | #6 | Exceptional 4.5% |
| Czechs | 100.0 /100 | #7 | Exceptional 4.5% |
| Luxembourgers | 100.0 /100 | #8 | Exceptional 4.5% |
| Thais | 100.0 /100 | #9 | Exceptional 4.6% |
| Cubans | 100.0 /100 | #10 | Exceptional 4.6% |
| Swedes | 100.0 /100 | #11 | Exceptional 4.6% |
| Immigrants | Bolivia | 100.0 /100 | #12 | Exceptional 4.7% |
| Bolivians | 100.0 /100 | #13 | Exceptional 4.7% |
| Germans | 100.0 /100 | #14 | Exceptional 4.7% |
| Scandinavians | 100.0 /100 | #15 | Exceptional 4.7% |
| Swiss | 99.9 /100 | #16 | Exceptional 4.7% |