Immigrants from South Eastern Asia vs Immigrants from Jamaica Unemployment Among Seniors over 75 years
COMPARE
Immigrants from South Eastern Asia
Immigrants from Jamaica
Unemployment Among Seniors over 75 years
Unemployment Among Seniors over 75 years Comparison
Immigrants from South Eastern Asia
Immigrants from Jamaica
8.5%
UNEMPLOYMENT AMONG SENIORS OVER 75 YEARS
85.8/ 100
METRIC RATING
146th/ 347
METRIC RANK
8.9%
UNEMPLOYMENT AMONG SENIORS OVER 75 YEARS
27.7/ 100
METRIC RATING
196th/ 347
METRIC RANK
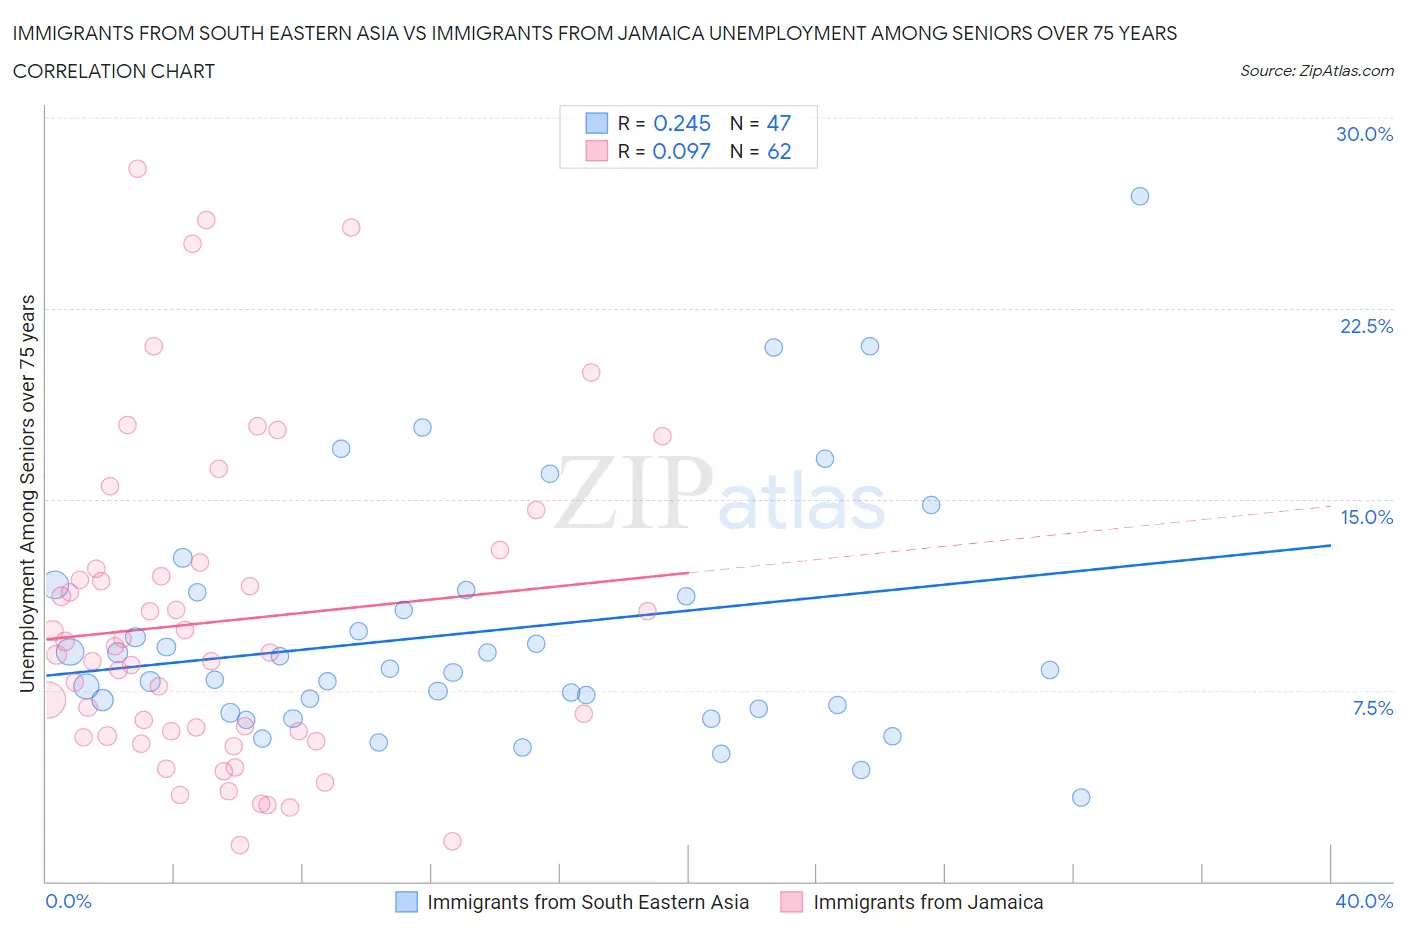
Immigrants from South Eastern Asia vs Immigrants from Jamaica Unemployment Among Seniors over 75 years Correlation Chart
The statistical analysis conducted on geographies consisting of 228,346,065 people shows a weak positive correlation between the proportion of Immigrants from South Eastern Asia and unemployment rate among seniors over the age of 75 in the United States with a correlation coefficient (R) of 0.245 and weighted average of 8.5%. Similarly, the statistical analysis conducted on geographies consisting of 168,253,642 people shows a slight positive correlation between the proportion of Immigrants from Jamaica and unemployment rate among seniors over the age of 75 in the United States with a correlation coefficient (R) of 0.097 and weighted average of 8.9%, a difference of 3.8%.
Unemployment Among Seniors over 75 years Correlation Summary
| Measurement | Immigrants from South Eastern Asia | Immigrants from Jamaica |
| Minimum | 3.3% | 1.4% |
| Maximum | 26.9% | 28.0% |
| Range | 23.6% | 26.6% |
| Mean | 9.8% | 10.2% |
| Median | 8.3% | 8.9% |
| Interquartile 25% (IQ1) | 6.8% | 5.7% |
| Interquartile 75% (IQ3) | 11.3% | 12.3% |
| Interquartile Range (IQR) | 4.6% | 6.6% |
| Standard Deviation (Sample) | 4.8% | 6.2% |
| Standard Deviation (Population) | 4.8% | 6.2% |
Similar Demographics by Unemployment Among Seniors over 75 years
Demographics Similar to Immigrants from South Eastern Asia by Unemployment Among Seniors over 75 years
In terms of unemployment among seniors over 75 years, the demographic groups most similar to Immigrants from South Eastern Asia are Immigrants from Sierra Leone (8.5%, a difference of 0.020%), Immigrants from Colombia (8.5%, a difference of 0.020%), Immigrants from Romania (8.5%, a difference of 0.050%), Colombian (8.5%, a difference of 0.11%), and Immigrants from Costa Rica (8.5%, a difference of 0.12%).
| Demographics | Rating | Rank | Unemployment Among Seniors over 75 years |
| Barbadians | 88.6 /100 | #139 | Excellent 8.5% |
| South Americans | 87.9 /100 | #140 | Excellent 8.5% |
| Immigrants | Bolivia | 87.9 /100 | #141 | Excellent 8.5% |
| Immigrants | Ukraine | 87.0 /100 | #142 | Excellent 8.5% |
| Immigrants | Costa Rica | 86.8 /100 | #143 | Excellent 8.5% |
| Colombians | 86.7 /100 | #144 | Excellent 8.5% |
| Immigrants | Romania | 86.2 /100 | #145 | Excellent 8.5% |
| Immigrants | South Eastern Asia | 85.8 /100 | #146 | Excellent 8.5% |
| Immigrants | Sierra Leone | 85.6 /100 | #147 | Excellent 8.5% |
| Immigrants | Colombia | 85.6 /100 | #148 | Excellent 8.5% |
| Immigrants | Ecuador | 84.6 /100 | #149 | Excellent 8.5% |
| Paiute | 82.5 /100 | #150 | Excellent 8.6% |
| Immigrants | Bosnia and Herzegovina | 80.6 /100 | #151 | Excellent 8.6% |
| Latvians | 80.5 /100 | #152 | Excellent 8.6% |
| Mongolians | 80.1 /100 | #153 | Excellent 8.6% |
Demographics Similar to Immigrants from Jamaica by Unemployment Among Seniors over 75 years
In terms of unemployment among seniors over 75 years, the demographic groups most similar to Immigrants from Jamaica are Okinawan (8.8%, a difference of 0.070%), Maltese (8.8%, a difference of 0.090%), Immigrants from Laos (8.9%, a difference of 0.10%), Eastern European (8.9%, a difference of 0.12%), and Immigrants from Guyana (8.8%, a difference of 0.14%).
| Demographics | Rating | Rank | Unemployment Among Seniors over 75 years |
| Immigrants | Haiti | 34.7 /100 | #189 | Fair 8.8% |
| Mexican American Indians | 34.7 /100 | #190 | Fair 8.8% |
| Estonians | 33.3 /100 | #191 | Fair 8.8% |
| Immigrants | Kenya | 31.8 /100 | #192 | Fair 8.8% |
| Immigrants | Guyana | 29.9 /100 | #193 | Fair 8.8% |
| Maltese | 29.2 /100 | #194 | Fair 8.8% |
| Okinawans | 28.9 /100 | #195 | Fair 8.8% |
| Immigrants | Jamaica | 27.7 /100 | #196 | Fair 8.9% |
| Immigrants | Laos | 26.3 /100 | #197 | Fair 8.9% |
| Eastern Europeans | 25.9 /100 | #198 | Fair 8.9% |
| Pakistanis | 25.4 /100 | #199 | Fair 8.9% |
| Osage | 25.4 /100 | #200 | Fair 8.9% |
| Immigrants | Peru | 24.3 /100 | #201 | Fair 8.9% |
| Russians | 24.1 /100 | #202 | Fair 8.9% |
| Immigrants | Northern Europe | 23.9 /100 | #203 | Fair 8.9% |