Immigrants from South Central Asia vs Honduran Unemployment Among Ages 60 to 64 years
COMPARE
Immigrants from South Central Asia
Honduran
Unemployment Among Ages 60 to 64 years
Unemployment Among Ages 60 to 64 years Comparison
Immigrants from South Central Asia
Hondurans
4.7%
UNEMPLOYMENT AMONG AGES 60 TO 64 YEARS
93.0/ 100
METRIC RATING
126th/ 347
METRIC RANK
5.1%
UNEMPLOYMENT AMONG AGES 60 TO 64 YEARS
0.5/ 100
METRIC RATING
259th/ 347
METRIC RANK
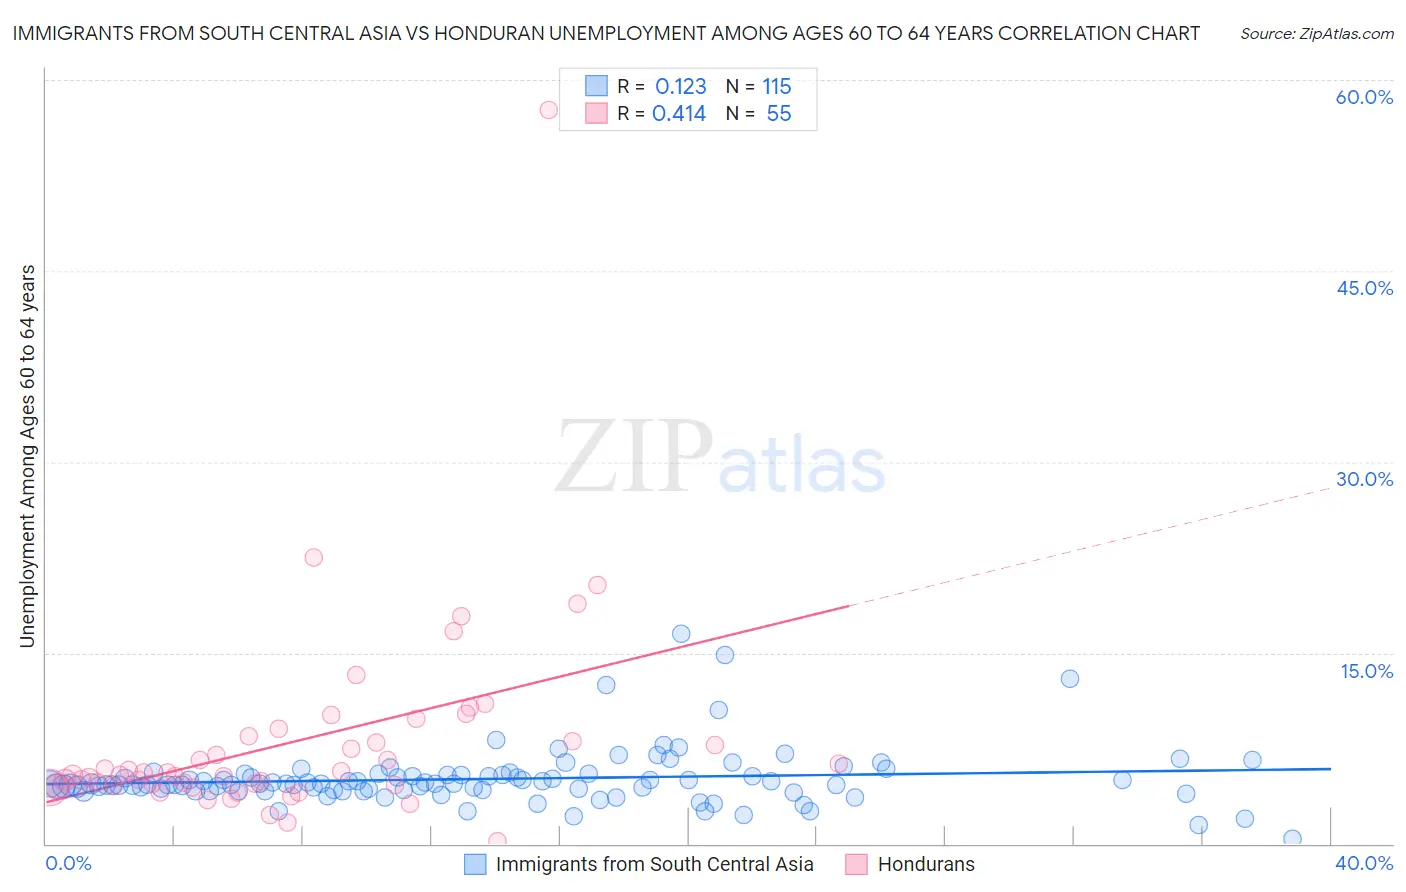
Immigrants from South Central Asia vs Honduran Unemployment Among Ages 60 to 64 years Correlation Chart
The statistical analysis conducted on geographies consisting of 418,199,861 people shows a poor positive correlation between the proportion of Immigrants from South Central Asia and unemployment rate among population between the ages 60 and 64 in the United States with a correlation coefficient (R) of 0.123 and weighted average of 4.7%. Similarly, the statistical analysis conducted on geographies consisting of 328,377,700 people shows a moderate positive correlation between the proportion of Hondurans and unemployment rate among population between the ages 60 and 64 in the United States with a correlation coefficient (R) of 0.414 and weighted average of 5.1%, a difference of 7.1%.
Unemployment Among Ages 60 to 64 years Correlation Summary
| Measurement | Immigrants from South Central Asia | Honduran |
| Minimum | 0.40% | 0.20% |
| Maximum | 16.5% | 57.6% |
| Range | 16.1% | 57.4% |
| Mean | 5.1% | 8.0% |
| Median | 4.7% | 5.4% |
| Interquartile 25% (IQ1) | 4.2% | 4.5% |
| Interquartile 75% (IQ3) | 5.4% | 8.4% |
| Interquartile Range (IQR) | 1.2% | 3.9% |
| Standard Deviation (Sample) | 2.2% | 8.2% |
| Standard Deviation (Population) | 2.2% | 8.1% |
Similar Demographics by Unemployment Among Ages 60 to 64 years
Demographics Similar to Immigrants from South Central Asia by Unemployment Among Ages 60 to 64 years
In terms of unemployment among ages 60 to 64 years, the demographic groups most similar to Immigrants from South Central Asia are Immigrants from Thailand (4.7%, a difference of 0.10%), Austrian (4.8%, a difference of 0.14%), Immigrants from Senegal (4.7%, a difference of 0.24%), Finnish (4.7%, a difference of 0.27%), and Choctaw (4.8%, a difference of 0.32%).
| Demographics | Rating | Rank | Unemployment Among Ages 60 to 64 years |
| Immigrants | Morocco | 95.7 /100 | #119 | Exceptional 4.7% |
| Macedonians | 95.7 /100 | #120 | Exceptional 4.7% |
| Albanians | 95.3 /100 | #121 | Exceptional 4.7% |
| Immigrants | Kazakhstan | 95.1 /100 | #122 | Exceptional 4.7% |
| Finns | 94.7 /100 | #123 | Exceptional 4.7% |
| Immigrants | Senegal | 94.5 /100 | #124 | Exceptional 4.7% |
| Immigrants | Thailand | 93.7 /100 | #125 | Exceptional 4.7% |
| Immigrants | South Central Asia | 93.0 /100 | #126 | Exceptional 4.7% |
| Austrians | 91.9 /100 | #127 | Exceptional 4.8% |
| Choctaw | 90.3 /100 | #128 | Exceptional 4.8% |
| Immigrants | Serbia | 90.2 /100 | #129 | Exceptional 4.8% |
| Immigrants | Syria | 90.1 /100 | #130 | Exceptional 4.8% |
| Immigrants | Lebanon | 89.6 /100 | #131 | Excellent 4.8% |
| Lithuanians | 89.6 /100 | #132 | Excellent 4.8% |
| Yaqui | 89.5 /100 | #133 | Excellent 4.8% |
Demographics Similar to Hondurans by Unemployment Among Ages 60 to 64 years
In terms of unemployment among ages 60 to 64 years, the demographic groups most similar to Hondurans are Celtic (5.1%, a difference of 0.010%), Immigrants from Honduras (5.1%, a difference of 0.13%), Japanese (5.1%, a difference of 0.17%), Immigrants from Ghana (5.1%, a difference of 0.23%), and Immigrants from Uzbekistan (5.1%, a difference of 0.25%).
| Demographics | Rating | Rank | Unemployment Among Ages 60 to 64 years |
| Immigrants | Switzerland | 0.9 /100 | #252 | Tragic 5.1% |
| Immigrants | China | 0.9 /100 | #253 | Tragic 5.1% |
| Costa Ricans | 0.8 /100 | #254 | Tragic 5.1% |
| Estonians | 0.8 /100 | #255 | Tragic 5.1% |
| Immigrants | Peru | 0.7 /100 | #256 | Tragic 5.1% |
| Japanese | 0.6 /100 | #257 | Tragic 5.1% |
| Celtics | 0.5 /100 | #258 | Tragic 5.1% |
| Hondurans | 0.5 /100 | #259 | Tragic 5.1% |
| Immigrants | Honduras | 0.4 /100 | #260 | Tragic 5.1% |
| Immigrants | Ghana | 0.4 /100 | #261 | Tragic 5.1% |
| Immigrants | Uzbekistan | 0.4 /100 | #262 | Tragic 5.1% |
| Immigrants | Immigrants | 0.4 /100 | #263 | Tragic 5.1% |
| Sioux | 0.3 /100 | #264 | Tragic 5.1% |
| Immigrants | Argentina | 0.2 /100 | #265 | Tragic 5.1% |
| Immigrants | Australia | 0.2 /100 | #266 | Tragic 5.1% |