Immigrants from Singapore vs Korean Male Unemployment
COMPARE
Immigrants from Singapore
Korean
Male Unemployment
Male Unemployment Comparison
Immigrants from Singapore
Koreans
4.9%
MALE UNEMPLOYMENT
99.4/ 100
METRIC RATING
36th/ 347
METRIC RANK
5.3%
MALE UNEMPLOYMENT
34.9/ 100
METRIC RATING
185th/ 347
METRIC RANK
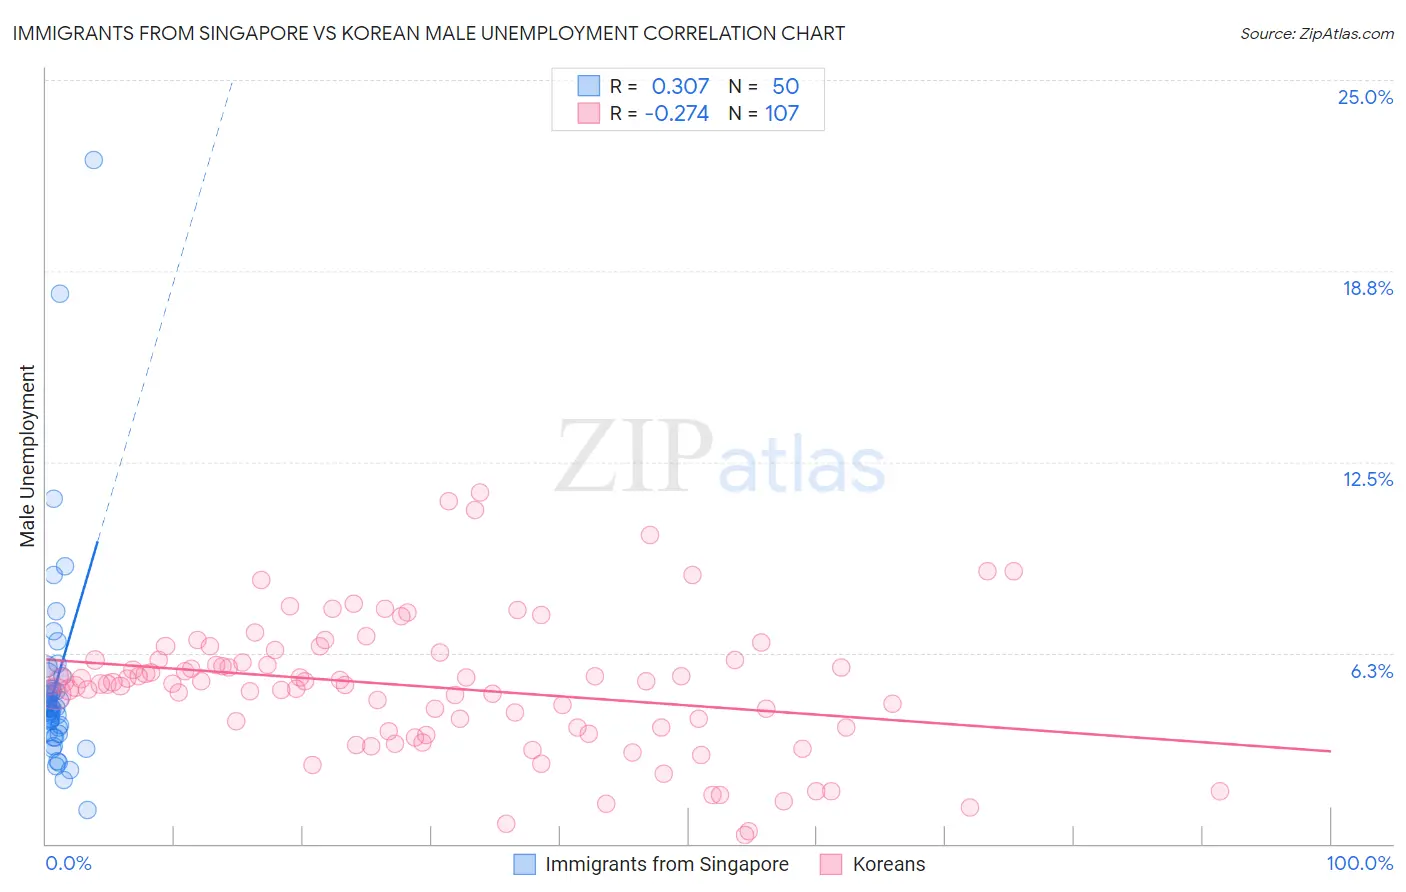
Immigrants from Singapore vs Korean Male Unemployment Correlation Chart
The statistical analysis conducted on geographies consisting of 137,392,215 people shows a mild positive correlation between the proportion of Immigrants from Singapore and unemployment rate among males in the United States with a correlation coefficient (R) of 0.307 and weighted average of 4.9%. Similarly, the statistical analysis conducted on geographies consisting of 506,883,728 people shows a weak negative correlation between the proportion of Koreans and unemployment rate among males in the United States with a correlation coefficient (R) of -0.274 and weighted average of 5.3%, a difference of 9.2%.
Male Unemployment Correlation Summary
| Measurement | Immigrants from Singapore | Korean |
| Minimum | 1.1% | 0.30% |
| Maximum | 22.4% | 11.5% |
| Range | 21.3% | 11.2% |
| Mean | 5.3% | 5.1% |
| Median | 4.4% | 5.3% |
| Interquartile 25% (IQ1) | 3.6% | 3.8% |
| Interquartile 75% (IQ3) | 5.1% | 6.0% |
| Interquartile Range (IQR) | 1.4% | 2.2% |
| Standard Deviation (Sample) | 3.6% | 2.2% |
| Standard Deviation (Population) | 3.6% | 2.2% |
Similar Demographics by Male Unemployment
Demographics Similar to Immigrants from Singapore by Male Unemployment
In terms of male unemployment, the demographic groups most similar to Immigrants from Singapore are Paraguayan (4.9%, a difference of 0.080%), Scotch-Irish (4.9%, a difference of 0.21%), Immigrants from Bosnia and Herzegovina (4.9%, a difference of 0.23%), Burmese (4.9%, a difference of 0.30%), and Northern European (4.9%, a difference of 0.38%).
| Demographics | Rating | Rank | Male Unemployment |
| Scottish | 99.8 /100 | #29 | Exceptional 4.8% |
| British | 99.8 /100 | #30 | Exceptional 4.8% |
| Sudanese | 99.8 /100 | #31 | Exceptional 4.8% |
| Immigrants | Nepal | 99.8 /100 | #32 | Exceptional 4.8% |
| Latvians | 99.7 /100 | #33 | Exceptional 4.8% |
| Welsh | 99.7 /100 | #34 | Exceptional 4.8% |
| Paraguayans | 99.5 /100 | #35 | Exceptional 4.9% |
| Immigrants | Singapore | 99.4 /100 | #36 | Exceptional 4.9% |
| Scotch-Irish | 99.4 /100 | #37 | Exceptional 4.9% |
| Immigrants | Bosnia and Herzegovina | 99.4 /100 | #38 | Exceptional 4.9% |
| Burmese | 99.3 /100 | #39 | Exceptional 4.9% |
| Northern Europeans | 99.3 /100 | #40 | Exceptional 4.9% |
| Chinese | 99.3 /100 | #41 | Exceptional 4.9% |
| Immigrants | Belgium | 99.2 /100 | #42 | Exceptional 4.9% |
| Immigrants | Japan | 99.2 /100 | #43 | Exceptional 4.9% |
Demographics Similar to Koreans by Male Unemployment
In terms of male unemployment, the demographic groups most similar to Koreans are Spaniard (5.3%, a difference of 0.010%), Taiwanese (5.3%, a difference of 0.17%), Potawatomi (5.3%, a difference of 0.18%), Immigrants from Afghanistan (5.3%, a difference of 0.19%), and Iraqi (5.4%, a difference of 0.22%).
| Demographics | Rating | Rank | Male Unemployment |
| Osage | 42.5 /100 | #178 | Average 5.3% |
| Immigrants | Oceania | 40.8 /100 | #179 | Average 5.3% |
| Malaysians | 39.6 /100 | #180 | Fair 5.3% |
| Immigrants | Afghanistan | 37.9 /100 | #181 | Fair 5.3% |
| Potawatomi | 37.8 /100 | #182 | Fair 5.3% |
| Taiwanese | 37.6 /100 | #183 | Fair 5.3% |
| Spaniards | 35.1 /100 | #184 | Fair 5.3% |
| Koreans | 34.9 /100 | #185 | Fair 5.3% |
| Iraqis | 31.6 /100 | #186 | Fair 5.4% |
| Costa Ricans | 31.3 /100 | #187 | Fair 5.4% |
| Arabs | 30.2 /100 | #188 | Fair 5.4% |
| Immigrants | South America | 29.4 /100 | #189 | Fair 5.4% |
| Immigrants | Uganda | 28.8 /100 | #190 | Fair 5.4% |
| Immigrants | South Eastern Asia | 28.2 /100 | #191 | Fair 5.4% |
| Immigrants | Belarus | 26.0 /100 | #192 | Fair 5.4% |