Immigrants from Sierra Leone vs Choctaw Unemployment Among Women with Children Under 6 years
COMPARE
Immigrants from Sierra Leone
Choctaw
Unemployment Among Women with Children Under 6 years
Unemployment Among Women with Children Under 6 years Comparison
Immigrants from Sierra Leone
Choctaw
8.2%
UNEMPLOYMENT AMONG WOMEN WITH CHILDREN UNDER 6 YEARS
1.1/ 100
METRIC RATING
249th/ 347
METRIC RANK
9.8%
UNEMPLOYMENT AMONG WOMEN WITH CHILDREN UNDER 6 YEARS
0.0/ 100
METRIC RATING
325th/ 347
METRIC RANK
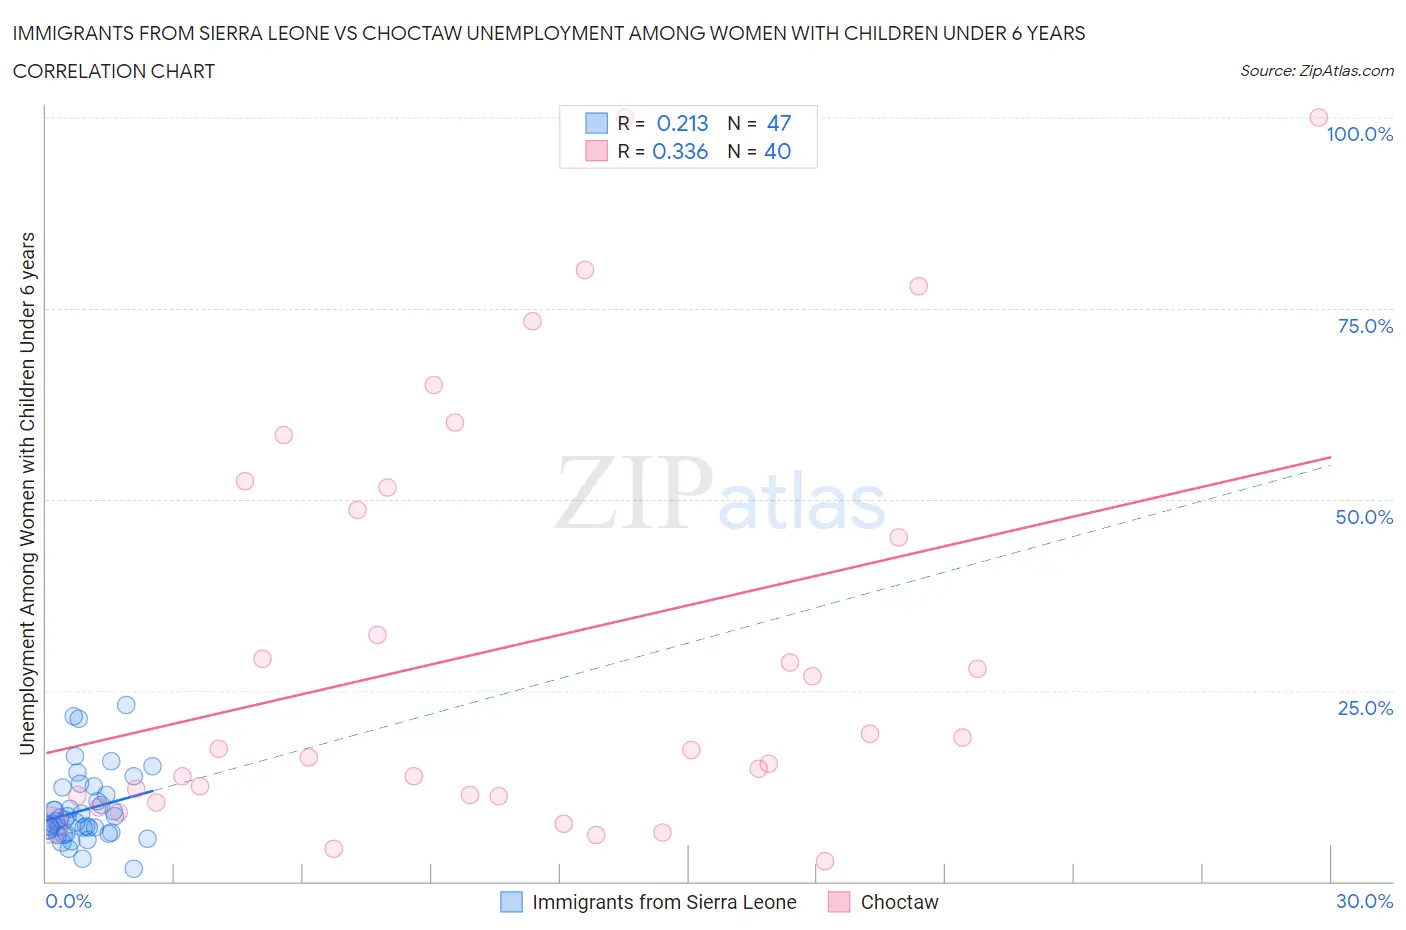
Immigrants from Sierra Leone vs Choctaw Unemployment Among Women with Children Under 6 years Correlation Chart
The statistical analysis conducted on geographies consisting of 92,718,305 people shows a weak positive correlation between the proportion of Immigrants from Sierra Leone and unemployment rate among women with children under the age of 6 in the United States with a correlation coefficient (R) of 0.213 and weighted average of 8.2%. Similarly, the statistical analysis conducted on geographies consisting of 218,001,226 people shows a mild positive correlation between the proportion of Choctaw and unemployment rate among women with children under the age of 6 in the United States with a correlation coefficient (R) of 0.336 and weighted average of 9.8%, a difference of 19.1%.
Unemployment Among Women with Children Under 6 years Correlation Summary
| Measurement | Immigrants from Sierra Leone | Choctaw |
| Minimum | 1.6% | 2.6% |
| Maximum | 23.1% | 100.0% |
| Range | 21.5% | 97.4% |
| Mean | 9.3% | 30.6% |
| Median | 7.9% | 17.3% |
| Interquartile 25% (IQ1) | 6.3% | 11.2% |
| Interquartile 75% (IQ3) | 11.3% | 50.1% |
| Interquartile Range (IQR) | 5.0% | 38.9% |
| Standard Deviation (Sample) | 4.6% | 27.3% |
| Standard Deviation (Population) | 4.6% | 27.0% |
Similar Demographics by Unemployment Among Women with Children Under 6 years
Demographics Similar to Immigrants from Sierra Leone by Unemployment Among Women with Children Under 6 years
In terms of unemployment among women with children under 6 years, the demographic groups most similar to Immigrants from Sierra Leone are Nigerian (8.2%, a difference of 0.010%), Immigrants from Western Africa (8.2%, a difference of 0.090%), German Russian (8.2%, a difference of 0.13%), Guyanese (8.2%, a difference of 0.18%), and Ghanaian (8.2%, a difference of 0.18%).
| Demographics | Rating | Rank | Unemployment Among Women with Children Under 6 years |
| Dutch | 2.5 /100 | #242 | Tragic 8.1% |
| Hawaiians | 1.8 /100 | #243 | Tragic 8.2% |
| French | 1.7 /100 | #244 | Tragic 8.2% |
| Native Hawaiians | 1.7 /100 | #245 | Tragic 8.2% |
| Central Americans | 1.4 /100 | #246 | Tragic 8.2% |
| German Russians | 1.2 /100 | #247 | Tragic 8.2% |
| Immigrants | Western Africa | 1.1 /100 | #248 | Tragic 8.2% |
| Immigrants | Sierra Leone | 1.1 /100 | #249 | Tragic 8.2% |
| Nigerians | 1.1 /100 | #250 | Tragic 8.2% |
| Guyanese | 1.0 /100 | #251 | Tragic 8.2% |
| Ghanaians | 1.0 /100 | #252 | Tragic 8.2% |
| Immigrants | Guyana | 0.8 /100 | #253 | Tragic 8.2% |
| Immigrants | Caribbean | 0.7 /100 | #254 | Tragic 8.3% |
| Immigrants | Portugal | 0.6 /100 | #255 | Tragic 8.3% |
| Celtics | 0.6 /100 | #256 | Tragic 8.3% |
Demographics Similar to Choctaw by Unemployment Among Women with Children Under 6 years
In terms of unemployment among women with children under 6 years, the demographic groups most similar to Choctaw are Delaware (9.8%, a difference of 0.030%), Ottawa (9.9%, a difference of 0.83%), Paiute (9.7%, a difference of 0.95%), Immigrants from Bahamas (9.6%, a difference of 1.7%), and Alaska Native (9.6%, a difference of 1.8%).
| Demographics | Rating | Rank | Unemployment Among Women with Children Under 6 years |
| Osage | 0.0 /100 | #318 | Tragic 9.5% |
| Marshallese | 0.0 /100 | #319 | Tragic 9.6% |
| Potawatomi | 0.0 /100 | #320 | Tragic 9.6% |
| Central American Indians | 0.0 /100 | #321 | Tragic 9.6% |
| Alaska Natives | 0.0 /100 | #322 | Tragic 9.6% |
| Immigrants | Bahamas | 0.0 /100 | #323 | Tragic 9.6% |
| Paiute | 0.0 /100 | #324 | Tragic 9.7% |
| Choctaw | 0.0 /100 | #325 | Tragic 9.8% |
| Delaware | 0.0 /100 | #326 | Tragic 9.8% |
| Ottawa | 0.0 /100 | #327 | Tragic 9.9% |
| Tohono O'odham | 0.0 /100 | #328 | Tragic 10.2% |
| Blacks/African Americans | 0.0 /100 | #329 | Tragic 10.3% |
| Pennsylvania Germans | 0.0 /100 | #330 | Tragic 10.8% |
| Colville | 0.0 /100 | #331 | Tragic 11.2% |
| Sioux | 0.0 /100 | #332 | Tragic 11.5% |