Immigrants from Senegal vs Immigrants from Eastern Asia Householder Income Under 25 years
COMPARE
Immigrants from Senegal
Immigrants from Eastern Asia
Householder Income Under 25 years
Householder Income Under 25 years Comparison
Immigrants from Senegal
Immigrants from Eastern Asia
$49,742
HOUSEHOLDER INCOME UNDER 25 YEARS
0.3/ 100
METRIC RATING
274th/ 347
METRIC RANK
$57,123
HOUSEHOLDER INCOME UNDER 25 YEARS
100.0/ 100
METRIC RATING
18th/ 347
METRIC RANK
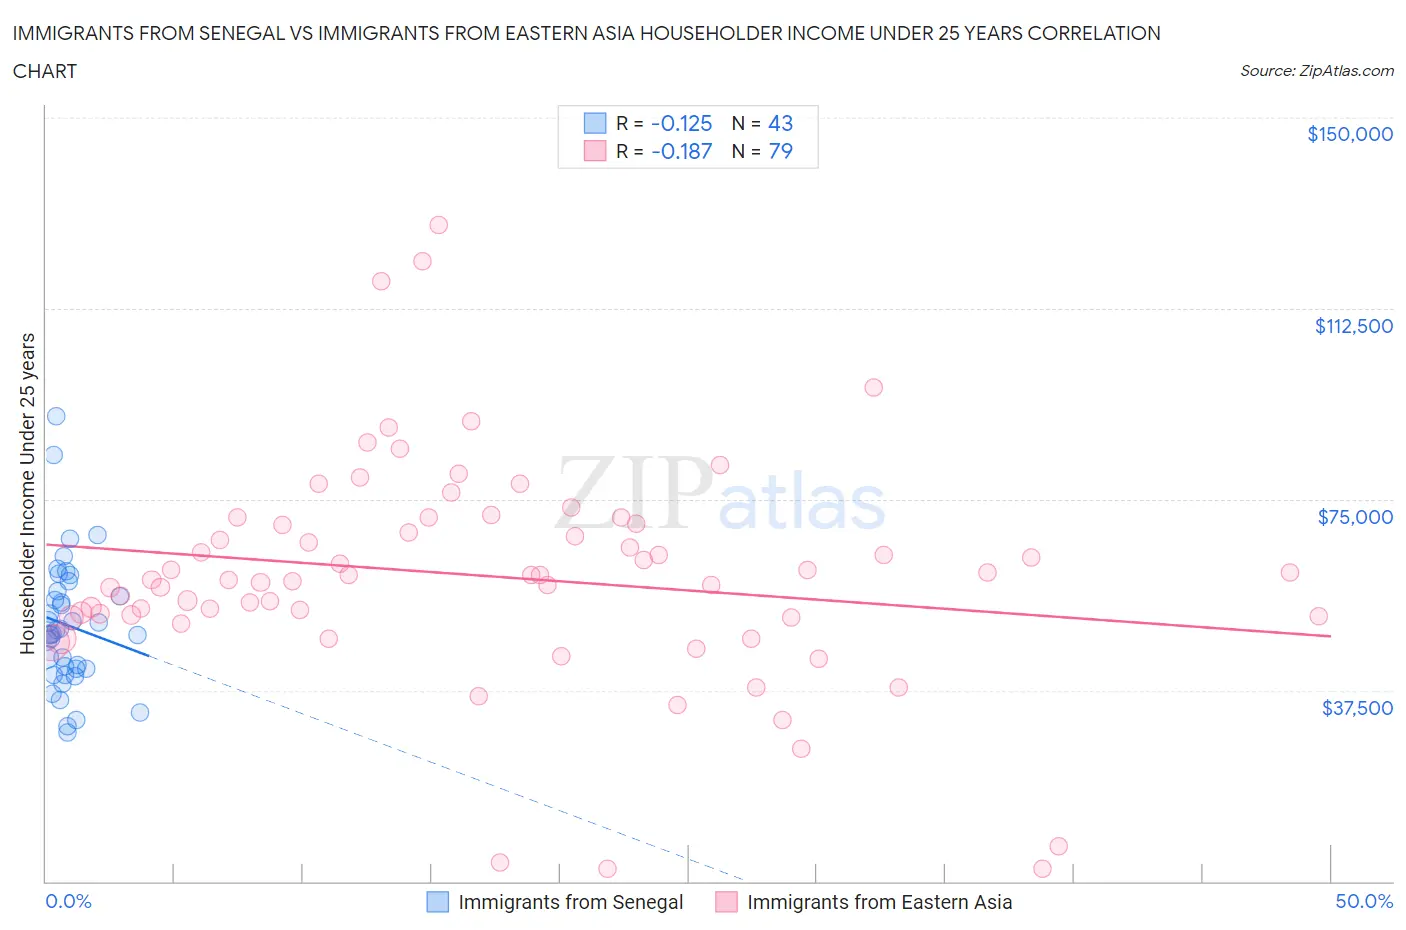
Immigrants from Senegal vs Immigrants from Eastern Asia Householder Income Under 25 years Correlation Chart
The statistical analysis conducted on geographies consisting of 85,448,384 people shows a poor negative correlation between the proportion of Immigrants from Senegal and household income with householder under the age of 25 in the United States with a correlation coefficient (R) of -0.125 and weighted average of $49,742. Similarly, the statistical analysis conducted on geographies consisting of 404,825,036 people shows a poor negative correlation between the proportion of Immigrants from Eastern Asia and household income with householder under the age of 25 in the United States with a correlation coefficient (R) of -0.187 and weighted average of $57,123, a difference of 14.8%.
Householder Income Under 25 years Correlation Summary
| Measurement | Immigrants from Senegal | Immigrants from Eastern Asia |
| Minimum | $29,259 | $2,499 |
| Maximum | $91,404 | $128,934 |
| Range | $62,145 | $126,435 |
| Mean | $50,222 | $60,019 |
| Median | $48,557 | $59,251 |
| Interquartile 25% (IQ1) | $41,620 | $51,848 |
| Interquartile 75% (IQ3) | $56,900 | $70,202 |
| Interquartile Range (IQR) | $15,280 | $18,354 |
| Standard Deviation (Sample) | $12,847 | $22,245 |
| Standard Deviation (Population) | $12,697 | $22,104 |
Similar Demographics by Householder Income Under 25 years
Demographics Similar to Immigrants from Senegal by Householder Income Under 25 years
In terms of householder income under 25 years, the demographic groups most similar to Immigrants from Senegal are Slovak ($49,753, a difference of 0.020%), Colville ($49,774, a difference of 0.060%), Taiwanese ($49,804, a difference of 0.12%), Immigrants from Kenya ($49,633, a difference of 0.22%), and Dominican ($49,633, a difference of 0.22%).
| Demographics | Rating | Rank | Householder Income Under 25 years |
| Immigrants | Laos | 0.5 /100 | #267 | Tragic $50,041 |
| Venezuelans | 0.5 /100 | #268 | Tragic $50,011 |
| Ute | 0.5 /100 | #269 | Tragic $49,997 |
| Mexicans | 0.5 /100 | #270 | Tragic $49,989 |
| Taiwanese | 0.3 /100 | #271 | Tragic $49,804 |
| Colville | 0.3 /100 | #272 | Tragic $49,774 |
| Slovaks | 0.3 /100 | #273 | Tragic $49,753 |
| Immigrants | Senegal | 0.3 /100 | #274 | Tragic $49,742 |
| Immigrants | Kenya | 0.2 /100 | #275 | Tragic $49,633 |
| Dominicans | 0.2 /100 | #276 | Tragic $49,633 |
| Immigrants | Western Africa | 0.2 /100 | #277 | Tragic $49,621 |
| Nigerians | 0.1 /100 | #278 | Tragic $49,416 |
| Apache | 0.1 /100 | #279 | Tragic $49,395 |
| Hmong | 0.1 /100 | #280 | Tragic $49,364 |
| Immigrants | Nonimmigrants | 0.1 /100 | #281 | Tragic $49,348 |
Demographics Similar to Immigrants from Eastern Asia by Householder Income Under 25 years
In terms of householder income under 25 years, the demographic groups most similar to Immigrants from Eastern Asia are Bhutanese ($57,078, a difference of 0.080%), Immigrants from Ireland ($57,075, a difference of 0.080%), Immigrants from Fiji ($57,074, a difference of 0.090%), Asian ($57,003, a difference of 0.21%), and Sierra Leonean ($57,272, a difference of 0.26%).
| Demographics | Rating | Rank | Householder Income Under 25 years |
| Immigrants | China | 100.0 /100 | #11 | Exceptional $57,931 |
| Immigrants | Philippines | 100.0 /100 | #12 | Exceptional $57,930 |
| Immigrants | South Central Asia | 100.0 /100 | #13 | Exceptional $57,818 |
| Filipinos | 100.0 /100 | #14 | Exceptional $57,740 |
| Koreans | 100.0 /100 | #15 | Exceptional $57,730 |
| Immigrants | Afghanistan | 100.0 /100 | #16 | Exceptional $57,478 |
| Sierra Leoneans | 100.0 /100 | #17 | Exceptional $57,272 |
| Immigrants | Eastern Asia | 100.0 /100 | #18 | Exceptional $57,123 |
| Bhutanese | 100.0 /100 | #19 | Exceptional $57,078 |
| Immigrants | Ireland | 100.0 /100 | #20 | Exceptional $57,075 |
| Immigrants | Fiji | 100.0 /100 | #21 | Exceptional $57,074 |
| Asians | 100.0 /100 | #22 | Exceptional $57,003 |
| Tongans | 100.0 /100 | #23 | Exceptional $56,972 |
| Immigrants | Singapore | 100.0 /100 | #24 | Exceptional $56,835 |
| Immigrants | Pakistan | 100.0 /100 | #25 | Exceptional $56,789 |