Immigrants from Russia vs Laotian Unemployment Among Women with Children Under 6 years
COMPARE
Immigrants from Russia
Laotian
Unemployment Among Women with Children Under 6 years
Unemployment Among Women with Children Under 6 years Comparison
Immigrants from Russia
Laotians
6.7%
UNEMPLOYMENT AMONG WOMEN WITH CHILDREN UNDER 6 YEARS
100.0/ 100
METRIC RATING
39th/ 347
METRIC RANK
6.5%
UNEMPLOYMENT AMONG WOMEN WITH CHILDREN UNDER 6 YEARS
100.0/ 100
METRIC RATING
24th/ 347
METRIC RANK
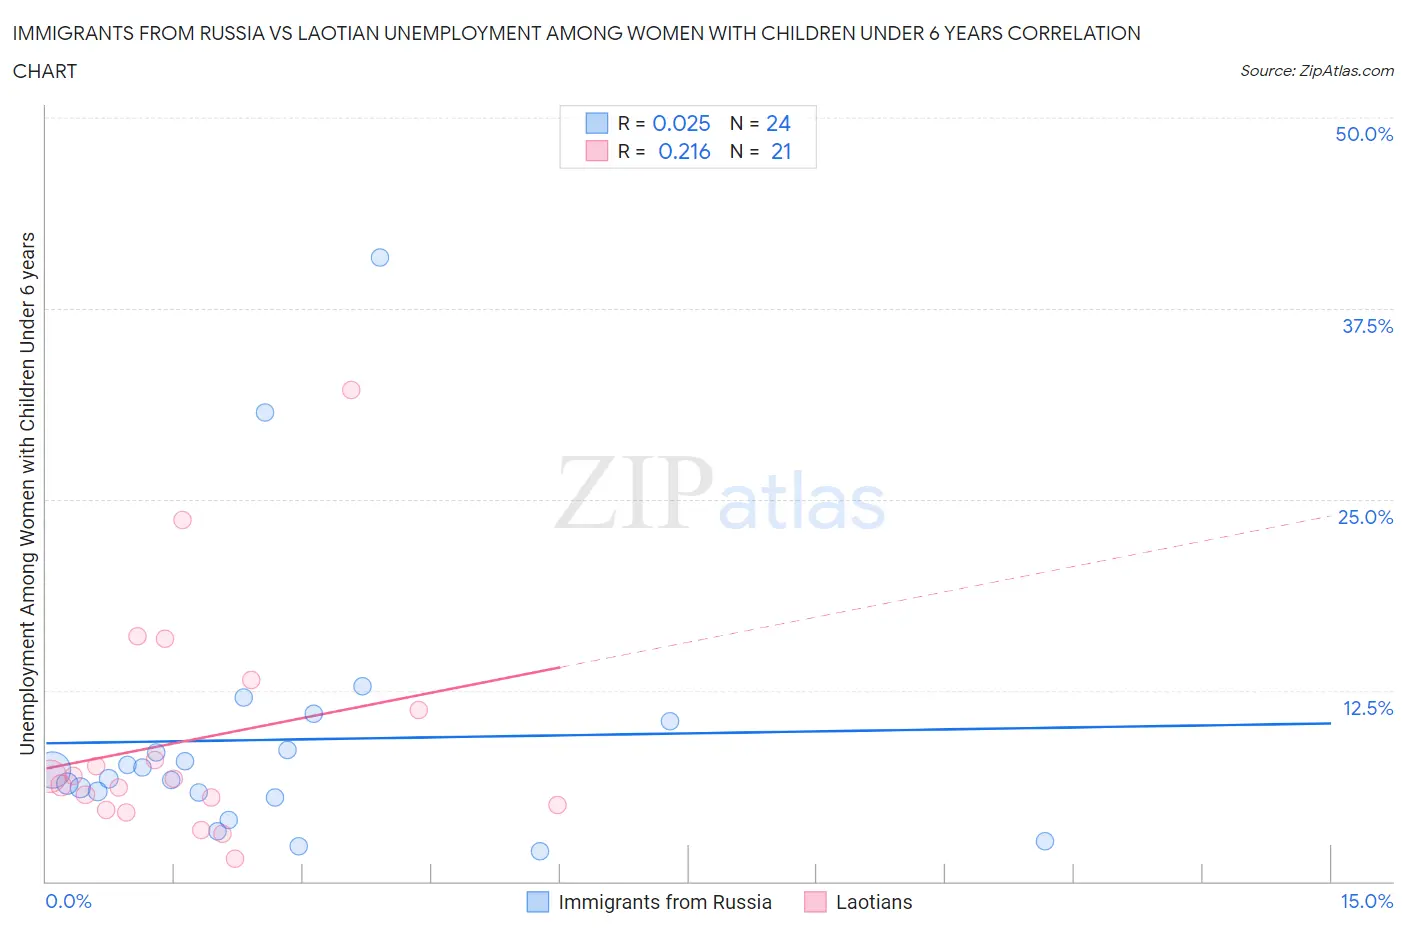
Immigrants from Russia vs Laotian Unemployment Among Women with Children Under 6 years Correlation Chart
The statistical analysis conducted on geographies consisting of 268,851,554 people shows no correlation between the proportion of Immigrants from Russia and unemployment rate among women with children under the age of 6 in the United States with a correlation coefficient (R) of 0.025 and weighted average of 6.7%. Similarly, the statistical analysis conducted on geographies consisting of 191,341,414 people shows a weak positive correlation between the proportion of Laotians and unemployment rate among women with children under the age of 6 in the United States with a correlation coefficient (R) of 0.216 and weighted average of 6.5%, a difference of 2.0%.
Unemployment Among Women with Children Under 6 years Correlation Summary
| Measurement | Immigrants from Russia | Laotian |
| Minimum | 2.0% | 1.5% |
| Maximum | 40.8% | 32.2% |
| Range | 38.8% | 30.7% |
| Mean | 9.3% | 9.2% |
| Median | 7.0% | 6.7% |
| Interquartile 25% (IQ1) | 5.7% | 4.8% |
| Interquartile 75% (IQ3) | 9.5% | 12.2% |
| Interquartile Range (IQR) | 3.9% | 7.3% |
| Standard Deviation (Sample) | 8.8% | 7.4% |
| Standard Deviation (Population) | 8.6% | 7.3% |
Demographics Similar to Immigrants from Russia and Laotians by Unemployment Among Women with Children Under 6 years
In terms of unemployment among women with children under 6 years, the demographic groups most similar to Immigrants from Russia are Hmong (6.7%, a difference of 0.060%), Sri Lankan (6.6%, a difference of 0.19%), Asian (6.7%, a difference of 0.22%), Immigrants from Indonesia (6.7%, a difference of 0.37%), and Luxembourger (6.6%, a difference of 0.45%). Similarly, the demographic groups most similar to Laotians are Soviet Union (6.5%, a difference of 0.020%), Cypriot (6.5%, a difference of 0.10%), Bulgarian (6.5%, a difference of 0.15%), Immigrants from Japan (6.5%, a difference of 0.20%), and Immigrants from Israel (6.5%, a difference of 0.22%).
| Demographics | Rating | Rank | Unemployment Among Women with Children Under 6 years |
| Burmese | 100.0 /100 | #21 | Exceptional 6.5% |
| Immigrants | Korea | 100.0 /100 | #22 | Exceptional 6.5% |
| Bulgarians | 100.0 /100 | #23 | Exceptional 6.5% |
| Laotians | 100.0 /100 | #24 | Exceptional 6.5% |
| Soviet Union | 100.0 /100 | #25 | Exceptional 6.5% |
| Cypriots | 100.0 /100 | #26 | Exceptional 6.5% |
| Immigrants | Japan | 100.0 /100 | #27 | Exceptional 6.5% |
| Immigrants | Israel | 100.0 /100 | #28 | Exceptional 6.5% |
| Immigrants | Sweden | 100.0 /100 | #29 | Exceptional 6.6% |
| Immigrants | Belarus | 100.0 /100 | #30 | Exceptional 6.6% |
| Immigrants | Moldova | 100.0 /100 | #31 | Exceptional 6.6% |
| Tsimshian | 100.0 /100 | #32 | Exceptional 6.6% |
| Immigrants | Vietnam | 100.0 /100 | #33 | Exceptional 6.6% |
| Immigrants | South Central Asia | 100.0 /100 | #34 | Exceptional 6.6% |
| Yakama | 100.0 /100 | #35 | Exceptional 6.6% |
| Luxembourgers | 100.0 /100 | #36 | Exceptional 6.6% |
| Sri Lankans | 100.0 /100 | #37 | Exceptional 6.6% |
| Hmong | 100.0 /100 | #38 | Exceptional 6.7% |
| Immigrants | Russia | 100.0 /100 | #39 | Exceptional 6.7% |
| Asians | 100.0 /100 | #40 | Exceptional 6.7% |
| Immigrants | Indonesia | 99.9 /100 | #41 | Exceptional 6.7% |