Immigrants from Costa Rica vs Cajun Male Unemployment
COMPARE
Immigrants from Costa Rica
Cajun
Male Unemployment
Male Unemployment Comparison
Immigrants from Costa Rica
Cajuns
5.5%
MALE UNEMPLOYMENT
11.4/ 100
METRIC RATING
205th/ 347
METRIC RANK
5.8%
MALE UNEMPLOYMENT
0.1/ 100
METRIC RATING
259th/ 347
METRIC RANK
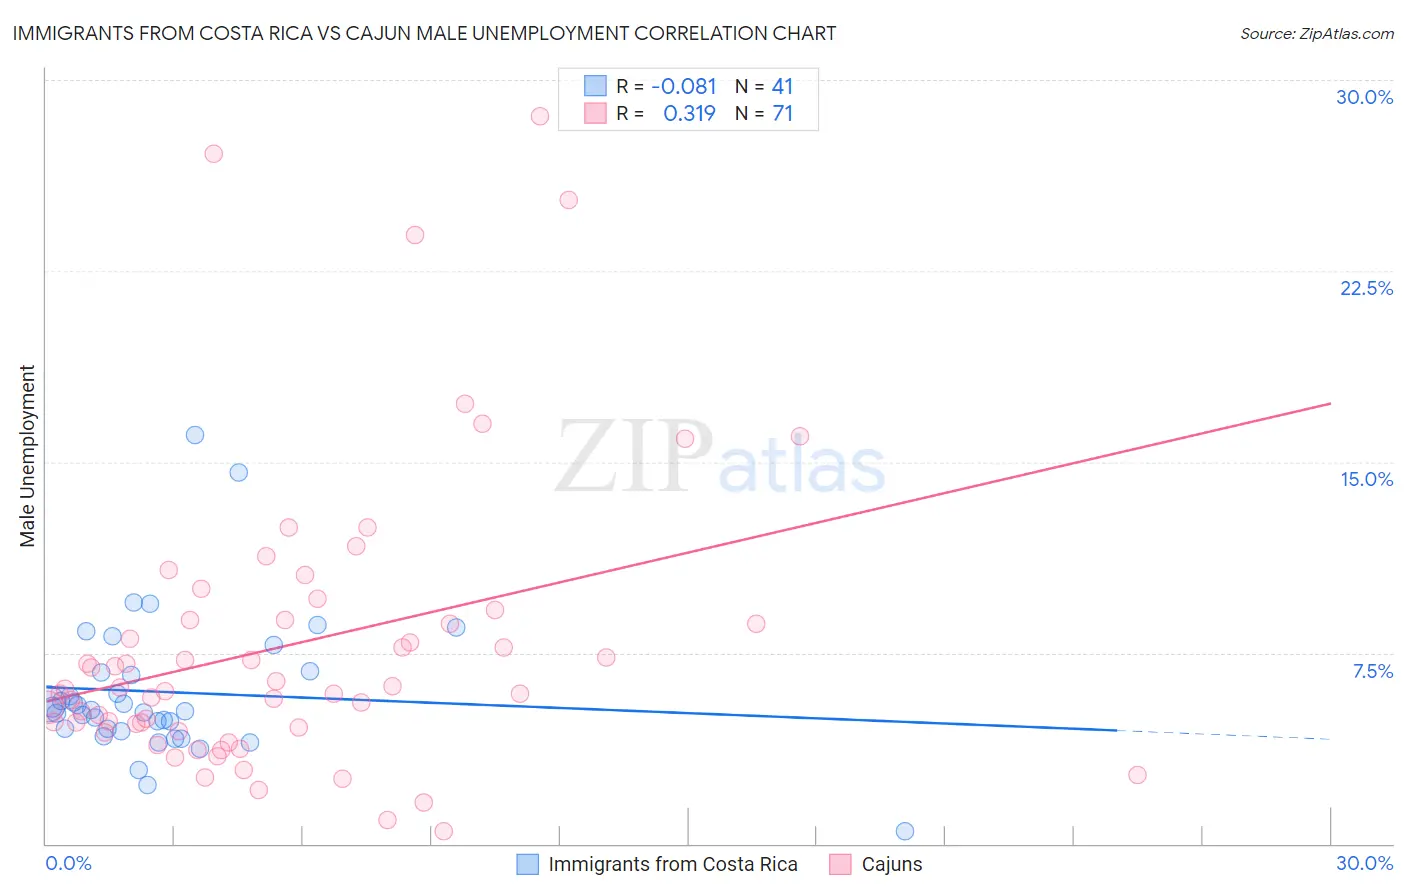
Immigrants from Costa Rica vs Cajun Male Unemployment Correlation Chart
The statistical analysis conducted on geographies consisting of 204,074,959 people shows a slight negative correlation between the proportion of Immigrants from Costa Rica and unemployment rate among males in the United States with a correlation coefficient (R) of -0.081 and weighted average of 5.5%. Similarly, the statistical analysis conducted on geographies consisting of 149,208,256 people shows a mild positive correlation between the proportion of Cajuns and unemployment rate among males in the United States with a correlation coefficient (R) of 0.319 and weighted average of 5.8%, a difference of 6.7%.
Male Unemployment Correlation Summary
| Measurement | Immigrants from Costa Rica | Cajun |
| Minimum | 0.50% | 0.50% |
| Maximum | 16.0% | 28.6% |
| Range | 15.5% | 28.1% |
| Mean | 6.0% | 7.8% |
| Median | 5.3% | 6.1% |
| Interquartile 25% (IQ1) | 4.5% | 4.6% |
| Interquartile 75% (IQ3) | 6.8% | 8.8% |
| Interquartile Range (IQR) | 2.3% | 4.2% |
| Standard Deviation (Sample) | 2.8% | 5.8% |
| Standard Deviation (Population) | 2.8% | 5.7% |
Similar Demographics by Male Unemployment
Demographics Similar to Immigrants from Costa Rica by Male Unemployment
In terms of male unemployment, the demographic groups most similar to Immigrants from Costa Rica are Guamanian/Chamorro (5.4%, a difference of 0.13%), Immigrants from Laos (5.4%, a difference of 0.22%), Immigrants from Ukraine (5.5%, a difference of 0.22%), Nonimmigrants (5.4%, a difference of 0.23%), and Immigrants from Philippines (5.4%, a difference of 0.27%).
| Demographics | Rating | Rank | Male Unemployment |
| Immigrants | Thailand | 14.7 /100 | #198 | Poor 5.4% |
| Immigrants | Greece | 14.5 /100 | #199 | Poor 5.4% |
| Immigrants | Zaire | 13.7 /100 | #200 | Poor 5.4% |
| Immigrants | Philippines | 13.5 /100 | #201 | Poor 5.4% |
| Immigrants | Nonimmigrants | 13.1 /100 | #202 | Poor 5.4% |
| Immigrants | Laos | 13.0 /100 | #203 | Poor 5.4% |
| Guamanians/Chamorros | 12.3 /100 | #204 | Poor 5.4% |
| Immigrants | Costa Rica | 11.4 /100 | #205 | Poor 5.5% |
| Immigrants | Ukraine | 9.9 /100 | #206 | Tragic 5.5% |
| Immigrants | Syria | 9.3 /100 | #207 | Tragic 5.5% |
| Immigrants | Lebanon | 8.6 /100 | #208 | Tragic 5.5% |
| Immigrants | Middle Africa | 8.3 /100 | #209 | Tragic 5.5% |
| South American Indians | 7.6 /100 | #210 | Tragic 5.5% |
| Israelis | 7.4 /100 | #211 | Tragic 5.5% |
| Hmong | 7.0 /100 | #212 | Tragic 5.5% |
Demographics Similar to Cajuns by Male Unemployment
In terms of male unemployment, the demographic groups most similar to Cajuns are Immigrants from Central America (5.8%, a difference of 0.060%), Dutch West Indian (5.8%, a difference of 0.15%), Liberian (5.8%, a difference of 0.24%), Hispanic or Latino (5.8%, a difference of 0.29%), and Comanche (5.8%, a difference of 0.46%).
| Demographics | Rating | Rank | Male Unemployment |
| Mexicans | 0.2 /100 | #252 | Tragic 5.8% |
| Mexican American Indians | 0.2 /100 | #253 | Tragic 5.8% |
| Japanese | 0.2 /100 | #254 | Tragic 5.8% |
| Kiowa | 0.2 /100 | #255 | Tragic 5.8% |
| Comanche | 0.2 /100 | #256 | Tragic 5.8% |
| Hispanics or Latinos | 0.1 /100 | #257 | Tragic 5.8% |
| Dutch West Indians | 0.1 /100 | #258 | Tragic 5.8% |
| Cajuns | 0.1 /100 | #259 | Tragic 5.8% |
| Immigrants | Central America | 0.1 /100 | #260 | Tragic 5.8% |
| Liberians | 0.1 /100 | #261 | Tragic 5.8% |
| Immigrants | Portugal | 0.1 /100 | #262 | Tragic 5.9% |
| Immigrants | Latin America | 0.1 /100 | #263 | Tragic 5.9% |
| Immigrants | Mexico | 0.0 /100 | #264 | Tragic 5.9% |
| French American Indians | 0.0 /100 | #265 | Tragic 5.9% |
| Bahamians | 0.0 /100 | #266 | Tragic 5.9% |