Immigrants from Romania vs Immigrants from Ireland Female Unemployment
COMPARE
Immigrants from Romania
Immigrants from Ireland
Female Unemployment
Female Unemployment Comparison
Immigrants from Romania
Immigrants from Ireland
5.1%
FEMALE UNEMPLOYMENT
88.1/ 100
METRIC RATING
120th/ 347
METRIC RANK
4.9%
FEMALE UNEMPLOYMENT
98.2/ 100
METRIC RATING
69th/ 347
METRIC RANK
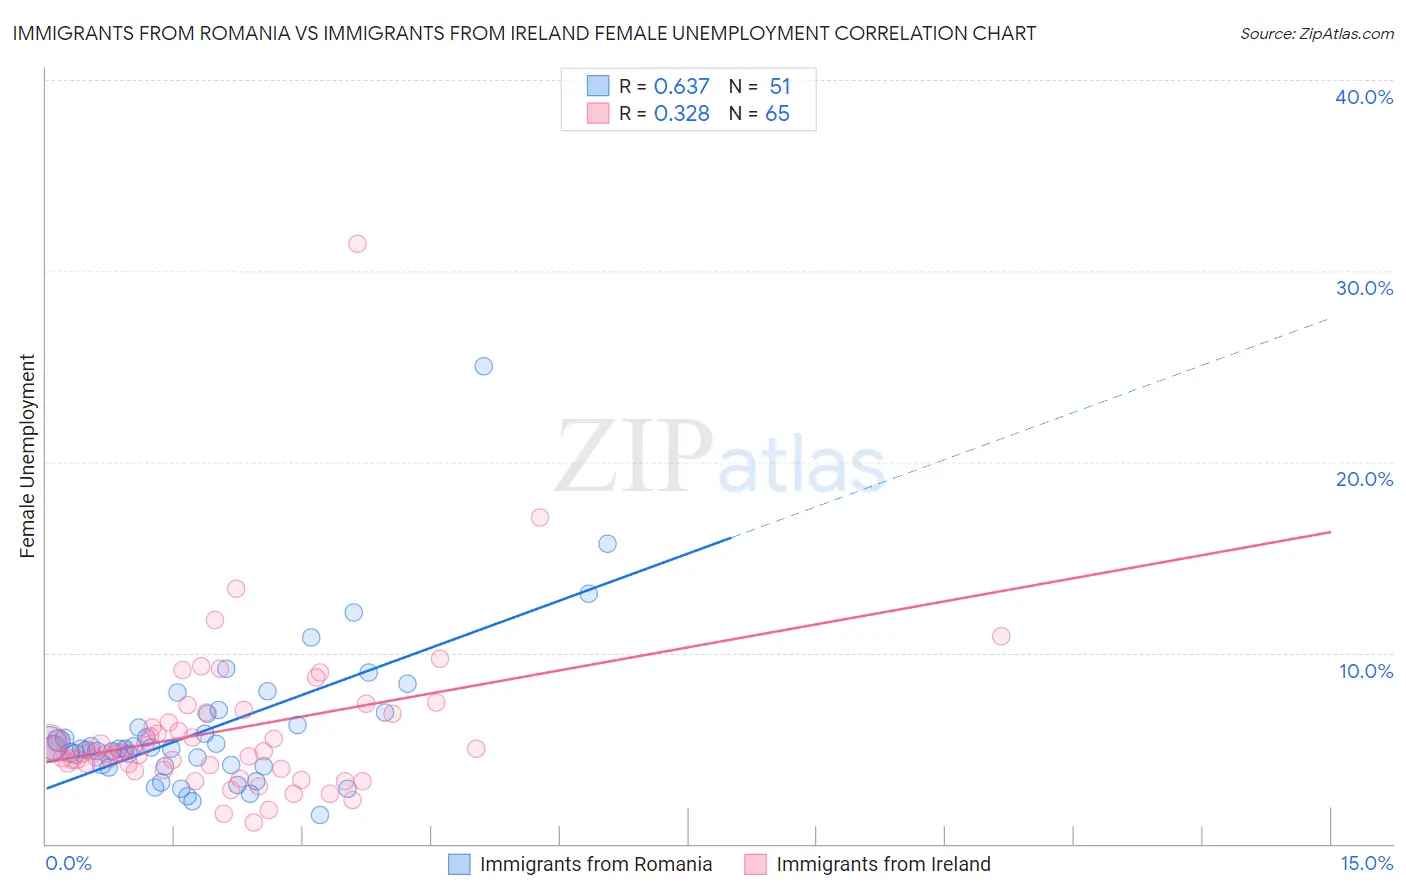
Immigrants from Romania vs Immigrants from Ireland Female Unemployment Correlation Chart
The statistical analysis conducted on geographies consisting of 256,484,740 people shows a significant positive correlation between the proportion of Immigrants from Romania and unemploymnet rate among females in the United States with a correlation coefficient (R) of 0.637 and weighted average of 5.1%. Similarly, the statistical analysis conducted on geographies consisting of 240,082,728 people shows a mild positive correlation between the proportion of Immigrants from Ireland and unemploymnet rate among females in the United States with a correlation coefficient (R) of 0.328 and weighted average of 4.9%, a difference of 3.2%.
Female Unemployment Correlation Summary
| Measurement | Immigrants from Romania | Immigrants from Ireland |
| Minimum | 1.5% | 1.1% |
| Maximum | 25.0% | 31.4% |
| Range | 23.5% | 30.3% |
| Mean | 6.0% | 5.9% |
| Median | 5.0% | 4.9% |
| Interquartile 25% (IQ1) | 4.0% | 4.0% |
| Interquartile 75% (IQ3) | 6.8% | 6.8% |
| Interquartile Range (IQR) | 2.7% | 2.8% |
| Standard Deviation (Sample) | 3.9% | 4.3% |
| Standard Deviation (Population) | 3.8% | 4.2% |
Similar Demographics by Female Unemployment
Demographics Similar to Immigrants from Romania by Female Unemployment
In terms of female unemployment, the demographic groups most similar to Immigrants from Romania are Immigrants from Western Europe (5.1%, a difference of 0.0%), Immigrants from North Macedonia (5.1%, a difference of 0.020%), Immigrants from Germany (5.1%, a difference of 0.080%), Immigrants from South Africa (5.1%, a difference of 0.080%), and Immigrants from Europe (5.1%, a difference of 0.13%).
| Demographics | Rating | Rank | Female Unemployment |
| Immigrants | Saudi Arabia | 91.2 /100 | #113 | Exceptional 5.1% |
| Immigrants | Turkey | 91.0 /100 | #114 | Exceptional 5.1% |
| Lebanese | 91.0 /100 | #115 | Exceptional 5.1% |
| Americans | 90.5 /100 | #116 | Exceptional 5.1% |
| Jordanians | 90.3 /100 | #117 | Exceptional 5.1% |
| Immigrants | Croatia | 89.9 /100 | #118 | Excellent 5.1% |
| Immigrants | North Macedonia | 88.3 /100 | #119 | Excellent 5.1% |
| Immigrants | Romania | 88.1 /100 | #120 | Excellent 5.1% |
| Immigrants | Western Europe | 88.1 /100 | #121 | Excellent 5.1% |
| Immigrants | Germany | 87.6 /100 | #122 | Excellent 5.1% |
| Immigrants | South Africa | 87.6 /100 | #123 | Excellent 5.1% |
| Immigrants | Europe | 87.2 /100 | #124 | Excellent 5.1% |
| Basques | 86.5 /100 | #125 | Excellent 5.1% |
| Immigrants | Korea | 86.3 /100 | #126 | Excellent 5.1% |
| Immigrants | Hungary | 86.0 /100 | #127 | Excellent 5.1% |
Demographics Similar to Immigrants from Ireland by Female Unemployment
In terms of female unemployment, the demographic groups most similar to Immigrants from Ireland are Tlingit-Haida (4.9%, a difference of 0.010%), Hungarian (4.9%, a difference of 0.020%), Cuban (4.9%, a difference of 0.020%), Osage (4.9%, a difference of 0.040%), and Immigrants from North America (4.9%, a difference of 0.050%).
| Demographics | Rating | Rank | Female Unemployment |
| Immigrants | Nepal | 98.6 /100 | #62 | Exceptional 4.9% |
| Immigrants | Belgium | 98.5 /100 | #63 | Exceptional 4.9% |
| Celtics | 98.5 /100 | #64 | Exceptional 4.9% |
| Immigrants | North America | 98.3 /100 | #65 | Exceptional 4.9% |
| Hungarians | 98.3 /100 | #66 | Exceptional 4.9% |
| Cubans | 98.3 /100 | #67 | Exceptional 4.9% |
| Tlingit-Haida | 98.3 /100 | #68 | Exceptional 4.9% |
| Immigrants | Ireland | 98.2 /100 | #69 | Exceptional 4.9% |
| Osage | 98.2 /100 | #70 | Exceptional 4.9% |
| German Russians | 98.1 /100 | #71 | Exceptional 4.9% |
| Immigrants | Northern Europe | 98.0 /100 | #72 | Exceptional 4.9% |
| Russians | 98.0 /100 | #73 | Exceptional 5.0% |
| Immigrants | Bolivia | 98.0 /100 | #74 | Exceptional 5.0% |
| Immigrants | Singapore | 98.0 /100 | #75 | Exceptional 5.0% |
| Immigrants | Venezuela | 97.9 /100 | #76 | Exceptional 5.0% |