Immigrants from Romania vs Immigrants from Portugal Unemployment Among Women with Children Ages 6 to 17 years
COMPARE
Immigrants from Romania
Immigrants from Portugal
Unemployment Among Women with Children Ages 6 to 17 years
Unemployment Among Women with Children Ages 6 to 17 years Comparison
Immigrants from Romania
Immigrants from Portugal
8.6%
UNEMPLOYMENT AMONG WOMEN WITH CHILDREN AGES 6 TO 17 YEARS
97.5/ 100
METRIC RATING
109th/ 347
METRIC RANK
9.7%
UNEMPLOYMENT AMONG WOMEN WITH CHILDREN AGES 6 TO 17 YEARS
0.1/ 100
METRIC RATING
276th/ 347
METRIC RANK
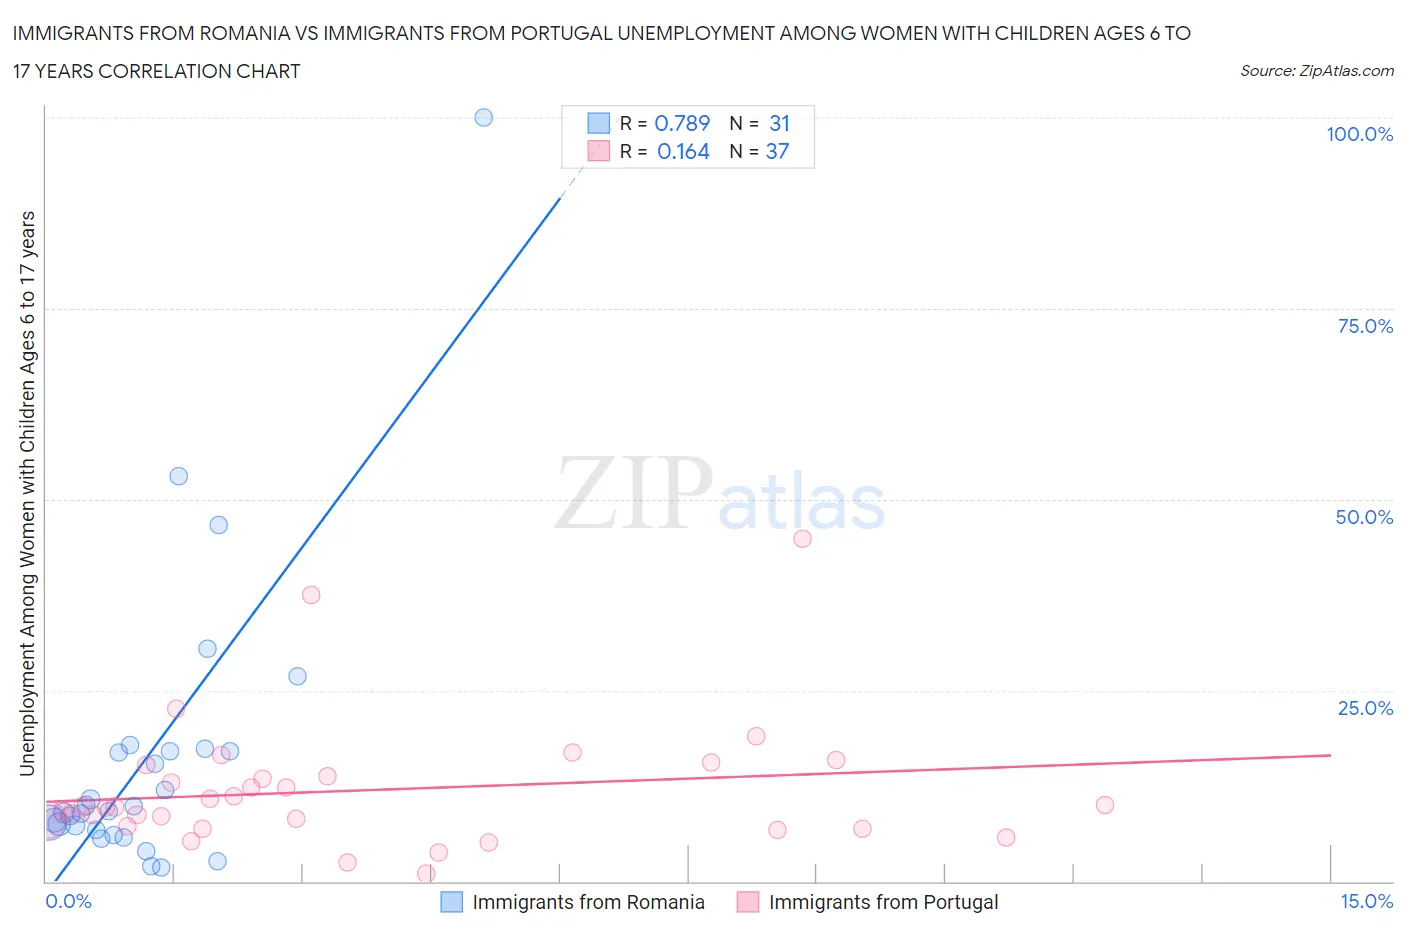
Immigrants from Romania vs Immigrants from Portugal Unemployment Among Women with Children Ages 6 to 17 years Correlation Chart
The statistical analysis conducted on geographies consisting of 195,503,585 people shows a strong positive correlation between the proportion of Immigrants from Romania and unemployment rate among women with children between the ages 6 and 17 in the United States with a correlation coefficient (R) of 0.789 and weighted average of 8.6%. Similarly, the statistical analysis conducted on geographies consisting of 140,175,329 people shows a poor positive correlation between the proportion of Immigrants from Portugal and unemployment rate among women with children between the ages 6 and 17 in the United States with a correlation coefficient (R) of 0.164 and weighted average of 9.7%, a difference of 12.6%.
Unemployment Among Women with Children Ages 6 to 17 years Correlation Summary
| Measurement | Immigrants from Romania | Immigrants from Portugal |
| Minimum | 1.9% | 1.0% |
| Maximum | 100.0% | 44.9% |
| Range | 98.1% | 43.9% |
| Mean | 16.2% | 11.9% |
| Median | 9.2% | 9.7% |
| Interquartile 25% (IQ1) | 6.7% | 7.0% |
| Interquartile 75% (IQ3) | 17.1% | 14.5% |
| Interquartile Range (IQR) | 10.4% | 7.4% |
| Standard Deviation (Sample) | 19.5% | 8.5% |
| Standard Deviation (Population) | 19.2% | 8.4% |
Similar Demographics by Unemployment Among Women with Children Ages 6 to 17 years
Demographics Similar to Immigrants from Romania by Unemployment Among Women with Children Ages 6 to 17 years
In terms of unemployment among women with children ages 6 to 17 years, the demographic groups most similar to Immigrants from Romania are Latvian (8.6%, a difference of 0.010%), Immigrants from Ukraine (8.6%, a difference of 0.020%), Swedish (8.6%, a difference of 0.070%), Chickasaw (8.6%, a difference of 0.080%), and Immigrants from Serbia (8.6%, a difference of 0.11%).
| Demographics | Rating | Rank | Unemployment Among Women with Children Ages 6 to 17 years |
| Immigrants | South Africa | 98.3 /100 | #102 | Exceptional 8.6% |
| Scandinavians | 98.3 /100 | #103 | Exceptional 8.6% |
| Immigrants | France | 98.0 /100 | #104 | Exceptional 8.6% |
| Immigrants | Norway | 97.8 /100 | #105 | Exceptional 8.6% |
| Immigrants | Serbia | 97.7 /100 | #106 | Exceptional 8.6% |
| Chickasaw | 97.6 /100 | #107 | Exceptional 8.6% |
| Swedes | 97.6 /100 | #108 | Exceptional 8.6% |
| Immigrants | Romania | 97.5 /100 | #109 | Exceptional 8.6% |
| Latvians | 97.4 /100 | #110 | Exceptional 8.6% |
| Immigrants | Ukraine | 97.4 /100 | #111 | Exceptional 8.6% |
| Romanians | 97.1 /100 | #112 | Exceptional 8.6% |
| Eastern Europeans | 96.8 /100 | #113 | Exceptional 8.6% |
| Immigrants | Russia | 96.7 /100 | #114 | Exceptional 8.6% |
| Argentineans | 96.5 /100 | #115 | Exceptional 8.6% |
| Zimbabweans | 96.3 /100 | #116 | Exceptional 8.6% |
Demographics Similar to Immigrants from Portugal by Unemployment Among Women with Children Ages 6 to 17 years
In terms of unemployment among women with children ages 6 to 17 years, the demographic groups most similar to Immigrants from Portugal are U.S. Virgin Islander (9.7%, a difference of 0.010%), British West Indian (9.7%, a difference of 0.050%), French (9.7%, a difference of 0.12%), Scotch-Irish (9.7%, a difference of 0.16%), and Seminole (9.7%, a difference of 0.35%).
| Demographics | Rating | Rank | Unemployment Among Women with Children Ages 6 to 17 years |
| Blackfeet | 0.2 /100 | #269 | Tragic 9.6% |
| Immigrants | Nicaragua | 0.2 /100 | #270 | Tragic 9.6% |
| Immigrants | Latin America | 0.1 /100 | #271 | Tragic 9.6% |
| Kiowa | 0.1 /100 | #272 | Tragic 9.6% |
| Whites/Caucasians | 0.1 /100 | #273 | Tragic 9.6% |
| Aleuts | 0.1 /100 | #274 | Tragic 9.6% |
| U.S. Virgin Islanders | 0.1 /100 | #275 | Tragic 9.7% |
| Immigrants | Portugal | 0.1 /100 | #276 | Tragic 9.7% |
| British West Indians | 0.1 /100 | #277 | Tragic 9.7% |
| French | 0.1 /100 | #278 | Tragic 9.7% |
| Scotch-Irish | 0.1 /100 | #279 | Tragic 9.7% |
| Seminole | 0.1 /100 | #280 | Tragic 9.7% |
| Jamaicans | 0.0 /100 | #281 | Tragic 9.8% |
| Slovaks | 0.0 /100 | #282 | Tragic 9.8% |
| Central American Indians | 0.0 /100 | #283 | Tragic 9.9% |