Lithuanian vs Immigrants from Portugal Unemployment Among Women with Children Ages 6 to 17 years
COMPARE
Lithuanian
Immigrants from Portugal
Unemployment Among Women with Children Ages 6 to 17 years
Unemployment Among Women with Children Ages 6 to 17 years Comparison
Lithuanians
Immigrants from Portugal
9.4%
UNEMPLOYMENT AMONG WOMEN WITH CHILDREN AGES 6 TO 17 YEARS
0.9/ 100
METRIC RATING
255th/ 347
METRIC RANK
9.7%
UNEMPLOYMENT AMONG WOMEN WITH CHILDREN AGES 6 TO 17 YEARS
0.1/ 100
METRIC RATING
276th/ 347
METRIC RANK
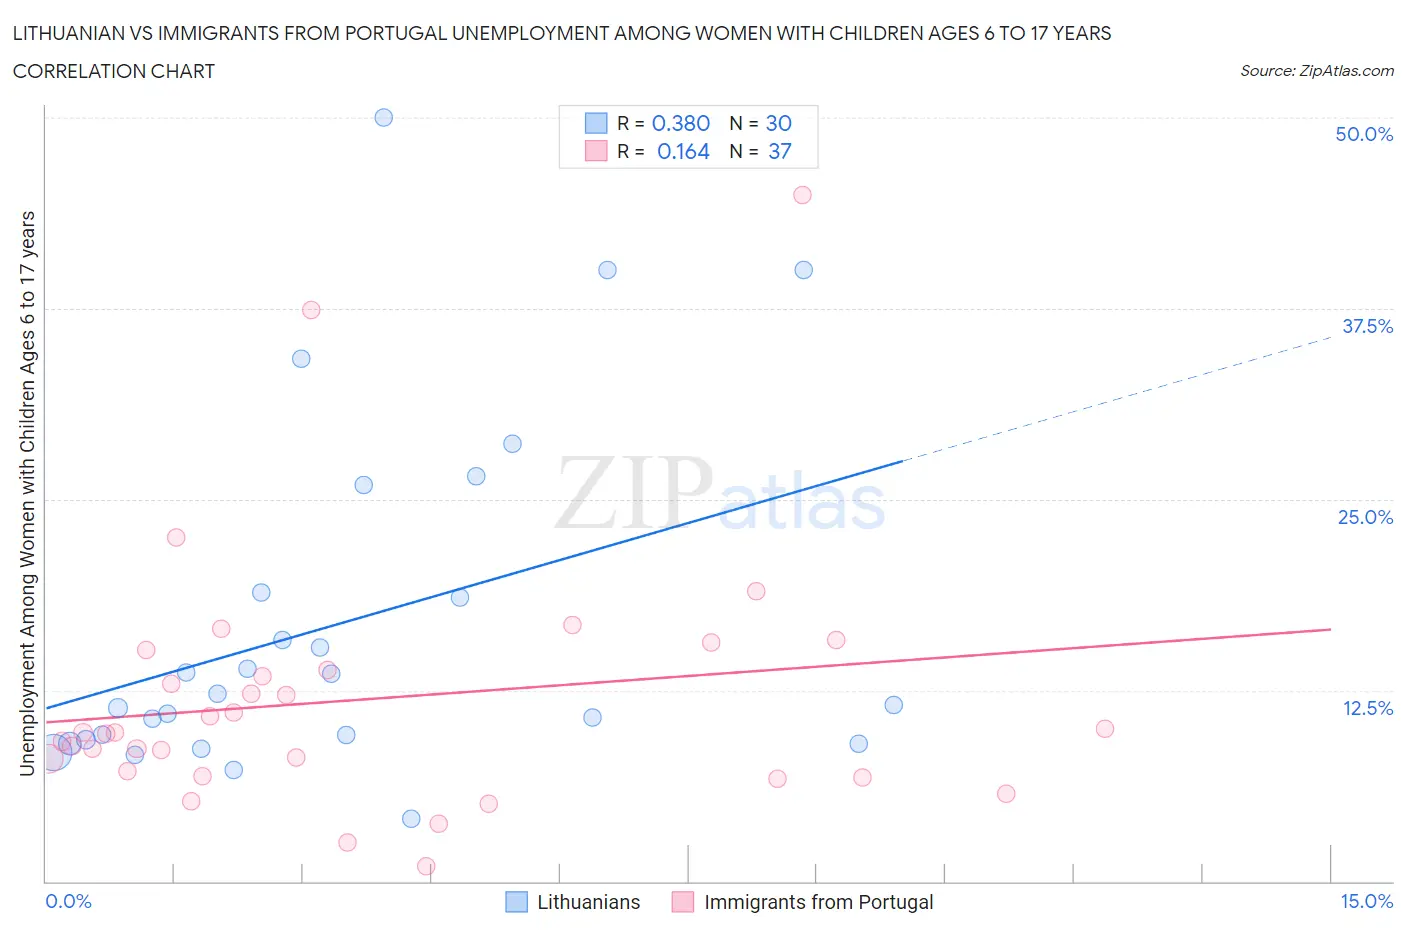
Lithuanian vs Immigrants from Portugal Unemployment Among Women with Children Ages 6 to 17 years Correlation Chart
The statistical analysis conducted on geographies consisting of 288,737,051 people shows a mild positive correlation between the proportion of Lithuanians and unemployment rate among women with children between the ages 6 and 17 in the United States with a correlation coefficient (R) of 0.380 and weighted average of 9.4%. Similarly, the statistical analysis conducted on geographies consisting of 140,175,329 people shows a poor positive correlation between the proportion of Immigrants from Portugal and unemployment rate among women with children between the ages 6 and 17 in the United States with a correlation coefficient (R) of 0.164 and weighted average of 9.7%, a difference of 2.7%.
Unemployment Among Women with Children Ages 6 to 17 years Correlation Summary
| Measurement | Lithuanian | Immigrants from Portugal |
| Minimum | 4.1% | 1.0% |
| Maximum | 50.0% | 44.9% |
| Range | 45.9% | 43.9% |
| Mean | 16.9% | 11.9% |
| Median | 11.9% | 9.7% |
| Interquartile 25% (IQ1) | 9.3% | 7.0% |
| Interquartile 75% (IQ3) | 18.9% | 14.5% |
| Interquartile Range (IQR) | 9.6% | 7.4% |
| Standard Deviation (Sample) | 11.4% | 8.5% |
| Standard Deviation (Population) | 11.2% | 8.4% |
Similar Demographics by Unemployment Among Women with Children Ages 6 to 17 years
Demographics Similar to Lithuanians by Unemployment Among Women with Children Ages 6 to 17 years
In terms of unemployment among women with children ages 6 to 17 years, the demographic groups most similar to Lithuanians are Nicaraguan (9.4%, a difference of 0.060%), Canadian (9.4%, a difference of 0.17%), Celtic (9.5%, a difference of 0.19%), Portuguese (9.4%, a difference of 0.23%), and Immigrants from Mexico (9.5%, a difference of 0.28%).
| Demographics | Rating | Rank | Unemployment Among Women with Children Ages 6 to 17 years |
| Dutch | 1.5 /100 | #248 | Tragic 9.4% |
| Immigrants | South America | 1.5 /100 | #249 | Tragic 9.4% |
| Immigrants | Guatemala | 1.3 /100 | #250 | Tragic 9.4% |
| Central Americans | 1.3 /100 | #251 | Tragic 9.4% |
| Creek | 1.2 /100 | #252 | Tragic 9.4% |
| Portuguese | 1.1 /100 | #253 | Tragic 9.4% |
| Nicaraguans | 1.0 /100 | #254 | Tragic 9.4% |
| Lithuanians | 0.9 /100 | #255 | Tragic 9.4% |
| Canadians | 0.8 /100 | #256 | Tragic 9.4% |
| Celtics | 0.7 /100 | #257 | Tragic 9.5% |
| Immigrants | Mexico | 0.7 /100 | #258 | Tragic 9.5% |
| Immigrants | Central America | 0.6 /100 | #259 | Tragic 9.5% |
| Italians | 0.6 /100 | #260 | Tragic 9.5% |
| South Americans | 0.5 /100 | #261 | Tragic 9.5% |
| Senegalese | 0.5 /100 | #262 | Tragic 9.5% |
Demographics Similar to Immigrants from Portugal by Unemployment Among Women with Children Ages 6 to 17 years
In terms of unemployment among women with children ages 6 to 17 years, the demographic groups most similar to Immigrants from Portugal are U.S. Virgin Islander (9.7%, a difference of 0.010%), British West Indian (9.7%, a difference of 0.050%), French (9.7%, a difference of 0.12%), Scotch-Irish (9.7%, a difference of 0.16%), and Seminole (9.7%, a difference of 0.35%).
| Demographics | Rating | Rank | Unemployment Among Women with Children Ages 6 to 17 years |
| Blackfeet | 0.2 /100 | #269 | Tragic 9.6% |
| Immigrants | Nicaragua | 0.2 /100 | #270 | Tragic 9.6% |
| Immigrants | Latin America | 0.1 /100 | #271 | Tragic 9.6% |
| Kiowa | 0.1 /100 | #272 | Tragic 9.6% |
| Whites/Caucasians | 0.1 /100 | #273 | Tragic 9.6% |
| Aleuts | 0.1 /100 | #274 | Tragic 9.6% |
| U.S. Virgin Islanders | 0.1 /100 | #275 | Tragic 9.7% |
| Immigrants | Portugal | 0.1 /100 | #276 | Tragic 9.7% |
| British West Indians | 0.1 /100 | #277 | Tragic 9.7% |
| French | 0.1 /100 | #278 | Tragic 9.7% |
| Scotch-Irish | 0.1 /100 | #279 | Tragic 9.7% |
| Seminole | 0.1 /100 | #280 | Tragic 9.7% |
| Jamaicans | 0.0 /100 | #281 | Tragic 9.8% |
| Slovaks | 0.0 /100 | #282 | Tragic 9.8% |
| Central American Indians | 0.0 /100 | #283 | Tragic 9.9% |