Immigrants from Philippines vs Immigrants from Somalia In Labor Force | Age 16-19

COMPARE

Immigrants from Philippines
Race
Ancestry
AfghanAfricanAlaska NativeAlaskan AthabascanAlbanianAleutAlsatianAmericanApacheArabArapahoArgentineanArmenianAssyrian/Chaldean/SyriacAustralianAustrianBahamianBangladeshiBarbadianBasqueBelgianBelizeanBermudanBhutaneseBlackfeetBolivianBrazilianBritishBritish West IndianBulgarianBurmeseCajunCambodianCanadianCape VerdeanCarpatho RusynCelticCentral AmericanCentral American IndianCherokeeCheyenneChickasawChileanChineseChippewaChoctawColombianColvilleComancheCosta RicanCreeCreekCroatianCrowCubanCypriotCzechCzechoslovakianDanishDelawareDominicanDutchDutch West IndianEastern EuropeanEcuadorianEgyptianEnglishEstonianEthiopianEuropeanFijianFilipinoFinnishFrenchFrench American IndianFrench CanadianGermanGerman RussianGhanaianGreekGuamanian/ChamorroGuatemalanGuyaneseHaitianHmongHonduranHopiHoumaHungarianIcelanderIndian (Asian)IndonesianInupiatIranianIraqiIrishIroquoisIsraeliItalianJamaicanJapaneseJordanianKenyanKiowaKoreanLaotianLatvianLebaneseLiberianLithuanianLumbeeLuxembourgerMacedonianMalaysianMalteseMarshalleseMenomineeMexicanMexican American IndianMongolianMoroccanNative HawaiianNavajoNepaleseNew ZealanderNicaraguanNigerianNorthern EuropeanNorwegianOkinawanOsageOttawaPaiutePakistaniPalestinianPanamanianParaguayanPennsylvania GermanPeruvianPimaPolishPortuguesePotawatomiPuebloPuerto RicanPuget Sound SalishRomanianRussianSalvadoranSamoanScandinavianScotch-IrishScottishSeminoleSenegaleseSerbianShoshoneSierra LeoneanSiouxSlavicSlovakSloveneSomaliSouth AfricanSouth AmericanSouth American IndianSoviet UnionSpaniardSpanishSpanish AmericanSpanish American IndianSri LankanSubsaharan AfricanSudaneseSwedishSwissSyrianTaiwaneseThaiTlingit-HaidaTohono O'OdhamTonganTrinidadian and TobagonianTsimshianTurkishU.S. Virgin IslanderUgandanUkrainianUruguayanUteVenezuelanVietnameseWelshWest IndianYakamaYaquiYugoslavianYumanYup'ikZimbabwean
Immigration
NonimmigrantsImmigrantsAfghanistanAfricaAlbaniaArgentinaArmeniaAsiaAustraliaAustriaBahamasBangladeshBarbadosBelarusBelgiumBelizeBoliviaBosnia and HerzegovinaBrazilBulgariaBurma/MyanmarCabo VerdeCambodiaCameroonCanadaCaribbeanCentral AmericaChileChinaColombiaCongoCosta RicaCroatiaCubaCzechoslovakiaDenmarkDominicaDominican RepublicEastern AfricaEastern AsiaEastern EuropeEcuadorEgyptEl SalvadorEnglandEritreaEthiopiaEuropeFijiFranceGermanyGhanaGreeceGrenadaGuatemalaGuyanaHaitiHondurasHong KongHungaryIndiaIndonesiaIranIraqIrelandIsraelItalyJamaicaJapanJordanKazakhstanKenyaKoreaKuwaitLaosLatin AmericaLatviaLebanonLiberiaLithuaniaMalaysiaMexicoMicronesiaMiddle AfricaMoldovaMoroccoNepalNetherlandsNicaraguaNigeriaNorth AmericaNorth MacedoniaNorthern AfricaNorthern EuropeNorwayOceaniaPakistanPanamaPeruPhilippinesPolandPortugalRomaniaRussiaSaudi ArabiaScotlandSenegalSerbiaSierra LeoneSingaporeSouth AfricaSouth AmericaSouth Central AsiaSouth Eastern AsiaSouthern EuropeSpainSri LankaSt. Vincent and the GrenadinesSudanSwedenSwitzerlandSyriaTaiwanThailandTrinidad and TobagoTurkeyUgandaUkraineUruguayUzbekistanVenezuelaVietnamWest IndiesWestern AfricaWestern AsiaWestern EuropeYemenZaireZimbabweAzores
Immigrants from Somalia
Race
Ancestry
AfghanAfricanAlaska NativeAlaskan AthabascanAlbanianAleutAlsatianAmericanApacheArabArapahoArgentineanArmenianAssyrian/Chaldean/SyriacAustralianAustrianBahamianBangladeshiBarbadianBasqueBelgianBelizeanBermudanBhutaneseBlackfeetBolivianBrazilianBritishBritish West IndianBulgarianBurmeseCajunCambodianCanadianCape VerdeanCarpatho RusynCelticCentral AmericanCentral American IndianCherokeeCheyenneChickasawChileanChineseChippewaChoctawColombianColvilleComancheCosta RicanCreeCreekCroatianCrowCubanCypriotCzechCzechoslovakianDanishDelawareDominicanDutchDutch West IndianEastern EuropeanEcuadorianEgyptianEnglishEstonianEthiopianEuropeanFijianFilipinoFinnishFrenchFrench American IndianFrench CanadianGermanGerman RussianGhanaianGreekGuamanian/ChamorroGuatemalanGuyaneseHaitianHmongHonduranHopiHoumaHungarianIcelanderIndian (Asian)IndonesianInupiatIranianIraqiIrishIroquoisIsraeliItalianJamaicanJapaneseJordanianKenyanKiowaKoreanLaotianLatvianLebaneseLiberianLithuanianLumbeeLuxembourgerMacedonianMalaysianMalteseMarshalleseMenomineeMexicanMexican American IndianMongolianMoroccanNative HawaiianNavajoNepaleseNew ZealanderNicaraguanNigerianNorthern EuropeanNorwegianOkinawanOsageOttawaPaiutePakistaniPalestinianPanamanianParaguayanPennsylvania GermanPeruvianPimaPolishPortuguesePotawatomiPuebloPuerto RicanPuget Sound SalishRomanianRussianSalvadoranSamoanScandinavianScotch-IrishScottishSeminoleSenegaleseSerbianShoshoneSierra LeoneanSiouxSlavicSlovakSloveneSomaliSouth AfricanSouth AmericanSouth American IndianSoviet UnionSpaniardSpanishSpanish AmericanSpanish American IndianSri LankanSubsaharan AfricanSudaneseSwedishSwissSyrianTaiwaneseThaiTlingit-HaidaTohono O'OdhamTonganTrinidadian and TobagonianTsimshianTurkishU.S. Virgin IslanderUgandanUkrainianUruguayanUteVenezuelanVietnameseWelshWest IndianYakamaYaquiYugoslavianYumanYup'ikZimbabwean
Immigration
NonimmigrantsImmigrantsAfghanistanAfricaAlbaniaArgentinaArmeniaAsiaAustraliaAustriaBahamasBangladeshBarbadosBelarusBelgiumBelizeBoliviaBosnia and HerzegovinaBrazilBulgariaBurma/MyanmarCabo VerdeCambodiaCameroonCanadaCaribbeanCentral AmericaChileChinaColombiaCongoCosta RicaCroatiaCubaCzechoslovakiaDenmarkDominicaDominican RepublicEastern AfricaEastern AsiaEastern EuropeEcuadorEgyptEl SalvadorEnglandEritreaEthiopiaEuropeFijiFranceGermanyGhanaGreeceGrenadaGuatemalaGuyanaHaitiHondurasHong KongHungaryIndiaIndonesiaIranIraqIrelandIsraelItalyJamaicaJapanJordanKazakhstanKenyaKoreaKuwaitLaosLatin AmericaLatviaLebanonLiberiaLithuaniaMalaysiaMexicoMicronesiaMiddle AfricaMoldovaMoroccoNepalNetherlandsNicaraguaNigeriaNorth AmericaNorth MacedoniaNorthern AfricaNorthern EuropeNorwayOceaniaPakistanPanamaPeruPolandPortugalRomaniaRussiaSaudi ArabiaScotlandSenegalSerbiaSierra LeoneSingaporeSomaliaSouth AfricaSouth AmericaSouth Central AsiaSouth Eastern AsiaSouthern EuropeSpainSri LankaSt. Vincent and the GrenadinesSudanSwedenSwitzerlandSyriaTaiwanThailandTrinidad and TobagoTurkeyUgandaUkraineUruguayUzbekistanVenezuelaVietnamWest IndiesWestern AfricaWestern AsiaWestern EuropeYemenZaireZimbabweAzores
In Labor Force | Age 16-19
Income
Poverty
Unemployment
Labor Participation
Family Structure
Vehicle Availability
Education Level
Disability

In Labor Force | Age 16-19 Comparison

Immigrants from Philippines

Immigrants from Somalia

Tragic
Exceptional
35.1%
IN LABOR FORCE | AGE 16-19
4.0/ 100
METRIC RATING
235th/ 347
METRIC RANK
45.6%
IN LABOR FORCE | AGE 16-19
100.0/ 100
METRIC RATING
3rd/ 347
METRIC RANK

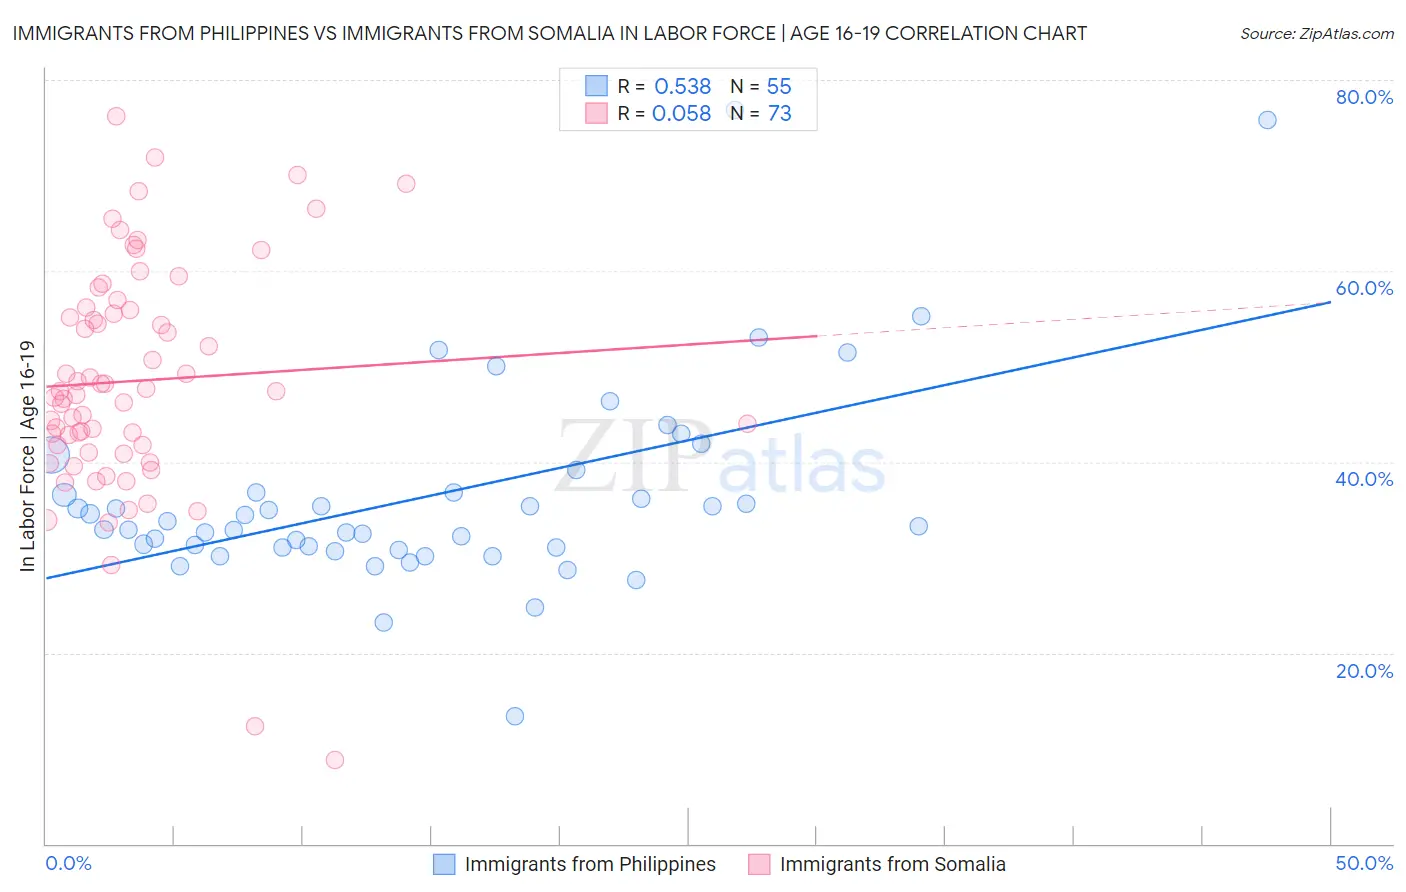
Immigrants from Philippines vs Immigrants from Somalia In Labor Force | Age 16-19 Correlation Chart

The statistical analysis conducted on geographies consisting of 470,219,281 people shows a substantial positive correlation between the proportion of Immigrants from Philippines and labor force participation rate among population between the ages 16 and 19 in the United States with a correlation coefficient (R) of 0.538 and weighted average of 35.1%. Similarly, the statistical analysis conducted on geographies consisting of 92,098,328 people shows a slight positive correlation between the proportion of Immigrants from Somalia and labor force participation rate among population between the ages 16 and 19 in the United States with a correlation coefficient (R) of 0.058 and weighted average of 45.6%, a difference of 29.8%.
Immigrants from Philippines vs Immigrants from Somalia In Labor Force | Age 16-19

In Labor Force | Age 16-19 Correlation Summary

MeasurementImmigrants from PhilippinesImmigrants from Somalia
Minimum13.4%8.8%
Maximum76.9%76.2%
Range63.5%67.4%
Mean36.4%48.5%
Median33.2%47.4%
Interquartile 25% (IQ1)31.0%41.4%
Interquartile 75% (IQ3)36.8%56.1%
Interquartile Range (IQR)5.8%14.7%
Standard Deviation (Sample)10.8%12.2%
Standard Deviation (Population)10.7%12.1%

Similar Demographics by In Labor Force | Age 16-19

Demographics Similar to Immigrants from Philippines by In Labor Force | Age 16-19

In terms of in labor force | age 16-19, the demographic groups most similar to Immigrants from Philippines are Immigrants from Mexico (35.1%, a difference of 0.080%), Immigrants from France (35.1%, a difference of 0.12%), Immigrants from Australia (35.1%, a difference of 0.14%), Immigrants from Syria (35.2%, a difference of 0.16%), and Immigrants from Kazakhstan (35.2%, a difference of 0.16%).
DemographicsRating | RankIn Labor Force | Age 16-19
Immigrants | Senegal
5.5
/100
|
#228
Tragic
35.3%
Immigrants | Lebanon
5.0
/100
|
#229
Tragic
35.2%
Immigrants | Honduras
4.9
/100
|
#230
Tragic
35.2%
Immigrants | Syria
4.5
/100
|
#231
Tragic
35.2%
Immigrants | Kazakhstan
4.5
/100
|
#232
Tragic
35.2%
Immigrants | France
4.3
/100
|
#233
Tragic
35.1%
Immigrants | Mexico
4.2
/100
|
#234
Tragic
35.1%
Immigrants | Philippines
4.0
/100
|
#235
Tragic
35.1%
Immigrants | Australia
3.6
/100
|
#236
Tragic
35.1%
Immigrants | India
3.5
/100
|
#237
Tragic
35.0%
Immigrants | Vietnam
3.4
/100
|
#238
Tragic
35.0%
Inupiat
3.2
/100
|
#239
Tragic
35.0%
Immigrants | Central America
3.0
/100
|
#240
Tragic
35.0%
Immigrants | Ireland
2.9
/100
|
#241
Tragic
35.0%
Uruguayans
2.6
/100
|
#242
Tragic
34.9%

Demographics Similar to Immigrants from Somalia by In Labor Force | Age 16-19

In terms of in labor force | age 16-19, the demographic groups most similar to Immigrants from Somalia are Luxembourger (45.3%, a difference of 0.65%), Alaskan Athabascan (45.2%, a difference of 0.83%), Somali (45.1%, a difference of 1.0%), Norwegian (46.2%, a difference of 1.3%), and Pennsylvania German (46.4%, a difference of 1.9%).
DemographicsRating | RankIn Labor Force | Age 16-19
Pennsylvania Germans
100.0
/100
|
#1
Exceptional
46.4%
Norwegians
100.0
/100
|
#2
Exceptional
46.2%
Immigrants | Somalia
100.0
/100
|
#3
Exceptional
45.6%
Luxembourgers
100.0
/100
|
#4
Exceptional
45.3%
Alaskan Athabascans
100.0
/100
|
#5
Exceptional
45.2%
Somalis
100.0
/100
|
#6
Exceptional
45.1%
Danes
100.0
/100
|
#7
Exceptional
44.7%
Immigrants | Cabo Verde
100.0
/100
|
#8
Exceptional
44.7%
Cape Verdeans
100.0
/100
|
#9
Exceptional
44.5%
Germans
100.0
/100
|
#10
Exceptional
44.2%
Swedes
100.0
/100
|
#11
Exceptional
44.1%
Finns
100.0
/100
|
#12
Exceptional
43.9%
Dutch
100.0
/100
|
#13
Exceptional
43.8%
Chippewa
100.0
/100
|
#14
Exceptional
43.8%
Slovenes
100.0
/100
|
#15
Exceptional
43.7%