Immigrants from Panama vs Tohono O'odham Unemployment Among Ages 35 to 44 years
COMPARE
Immigrants from Panama
Tohono O'odham
Unemployment Among Ages 35 to 44 years
Unemployment Among Ages 35 to 44 years Comparison
Immigrants from Panama
Tohono O'odham
5.0%
UNEMPLOYMENT AMONG AGES 35 TO 44 YEARS
3.3/ 100
METRIC RATING
223rd/ 347
METRIC RANK
8.4%
UNEMPLOYMENT AMONG AGES 35 TO 44 YEARS
0.0/ 100
METRIC RATING
337th/ 347
METRIC RANK
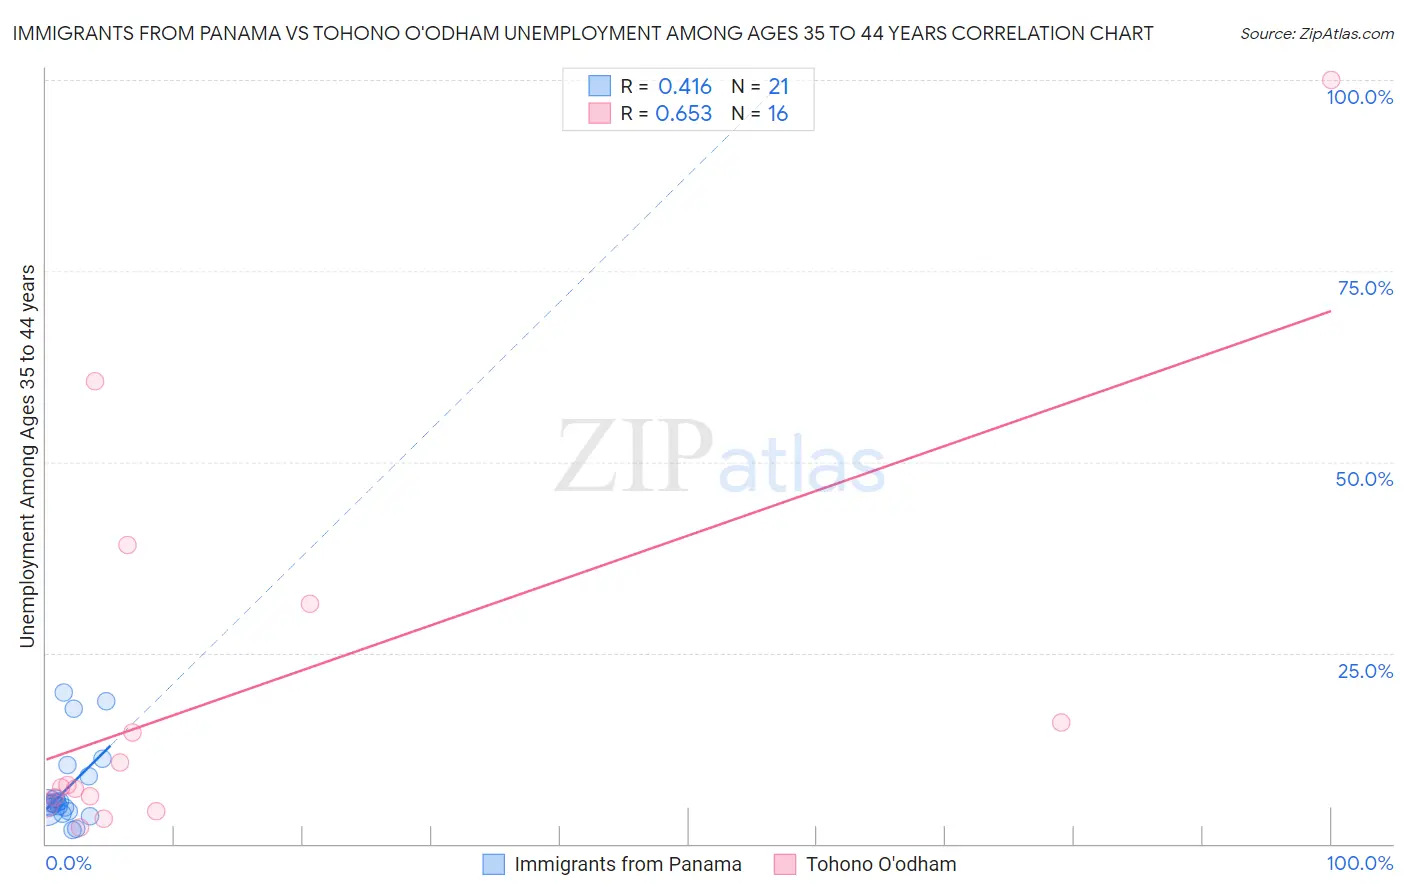
Immigrants from Panama vs Tohono O'odham Unemployment Among Ages 35 to 44 years Correlation Chart
The statistical analysis conducted on geographies consisting of 219,440,273 people shows a moderate positive correlation between the proportion of Immigrants from Panama and unemployment rate among population between the ages 35 and 44 in the United States with a correlation coefficient (R) of 0.416 and weighted average of 5.0%. Similarly, the statistical analysis conducted on geographies consisting of 58,558,955 people shows a significant positive correlation between the proportion of Tohono O'odham and unemployment rate among population between the ages 35 and 44 in the United States with a correlation coefficient (R) of 0.653 and weighted average of 8.4%, a difference of 69.8%.
Unemployment Among Ages 35 to 44 years Correlation Summary
| Measurement | Immigrants from Panama | Tohono O'odham |
| Minimum | 1.9% | 2.2% |
| Maximum | 19.8% | 100.0% |
| Range | 17.9% | 97.8% |
| Mean | 7.3% | 20.1% |
| Median | 5.2% | 7.5% |
| Interquartile 25% (IQ1) | 4.5% | 5.6% |
| Interquartile 75% (IQ3) | 9.6% | 23.7% |
| Interquartile Range (IQR) | 5.1% | 18.1% |
| Standard Deviation (Sample) | 5.3% | 26.6% |
| Standard Deviation (Population) | 5.1% | 25.7% |
Similar Demographics by Unemployment Among Ages 35 to 44 years
Demographics Similar to Immigrants from Panama by Unemployment Among Ages 35 to 44 years
In terms of unemployment among ages 35 to 44 years, the demographic groups most similar to Immigrants from Panama are Hmong (5.0%, a difference of 0.080%), Panamanian (5.0%, a difference of 0.23%), Bermudan (5.0%, a difference of 0.27%), Immigrants from Lebanon (5.0%, a difference of 0.35%), and Potawatomi (5.0%, a difference of 0.46%).
| Demographics | Rating | Rank | Unemployment Among Ages 35 to 44 years |
| Americans | 6.2 /100 | #216 | Tragic 4.9% |
| Moroccans | 6.0 /100 | #217 | Tragic 4.9% |
| Chickasaw | 5.7 /100 | #218 | Tragic 4.9% |
| Sierra Leoneans | 4.8 /100 | #219 | Tragic 4.9% |
| Immigrants | Sierra Leone | 4.7 /100 | #220 | Tragic 4.9% |
| Bermudans | 3.9 /100 | #221 | Tragic 5.0% |
| Hmong | 3.5 /100 | #222 | Tragic 5.0% |
| Immigrants | Panama | 3.3 /100 | #223 | Tragic 5.0% |
| Panamanians | 2.9 /100 | #224 | Tragic 5.0% |
| Immigrants | Lebanon | 2.7 /100 | #225 | Tragic 5.0% |
| Potawatomi | 2.5 /100 | #226 | Tragic 5.0% |
| Immigrants | Uzbekistan | 1.9 /100 | #227 | Tragic 5.0% |
| Samoans | 1.8 /100 | #228 | Tragic 5.0% |
| Immigrants | Cambodia | 1.5 /100 | #229 | Tragic 5.0% |
| Liberians | 1.3 /100 | #230 | Tragic 5.1% |
Demographics Similar to Tohono O'odham by Unemployment Among Ages 35 to 44 years
In terms of unemployment among ages 35 to 44 years, the demographic groups most similar to Tohono O'odham are Apache (8.4%, a difference of 0.36%), Cheyenne (8.5%, a difference of 0.51%), Sioux (8.4%, a difference of 0.65%), Inupiat (8.6%, a difference of 1.6%), and Alaskan Athabascan (8.6%, a difference of 2.3%).
| Demographics | Rating | Rank | Unemployment Among Ages 35 to 44 years |
| Immigrants | Cabo Verde | 0.0 /100 | #330 | Tragic 6.9% |
| Pueblo | 0.0 /100 | #331 | Tragic 7.1% |
| Natives/Alaskans | 0.0 /100 | #332 | Tragic 7.3% |
| Puerto Ricans | 0.0 /100 | #333 | Tragic 7.6% |
| Houma | 0.0 /100 | #334 | Tragic 7.8% |
| Sioux | 0.0 /100 | #335 | Tragic 8.4% |
| Apache | 0.0 /100 | #336 | Tragic 8.4% |
| Tohono O'odham | 0.0 /100 | #337 | Tragic 8.4% |
| Cheyenne | 0.0 /100 | #338 | Tragic 8.5% |
| Inupiat | 0.0 /100 | #339 | Tragic 8.6% |
| Alaskan Athabascans | 0.0 /100 | #340 | Tragic 8.6% |
| Hopi | 0.0 /100 | #341 | Tragic 8.9% |
| Navajo | 0.0 /100 | #342 | Tragic 9.3% |
| Arapaho | 0.0 /100 | #343 | Tragic 10.3% |
| Pima | 0.0 /100 | #344 | Tragic 11.8% |