Immigrants from Pakistan vs Chickasaw Unemployment Among Women with Children Under 6 years
COMPARE
Immigrants from Pakistan
Chickasaw
Unemployment Among Women with Children Under 6 years
Unemployment Among Women with Children Under 6 years Comparison
Immigrants from Pakistan
Chickasaw
7.2%
UNEMPLOYMENT AMONG WOMEN WITH CHILDREN UNDER 6 YEARS
97.2/ 100
METRIC RATING
106th/ 347
METRIC RANK
9.0%
UNEMPLOYMENT AMONG WOMEN WITH CHILDREN UNDER 6 YEARS
0.0/ 100
METRIC RATING
301st/ 347
METRIC RANK
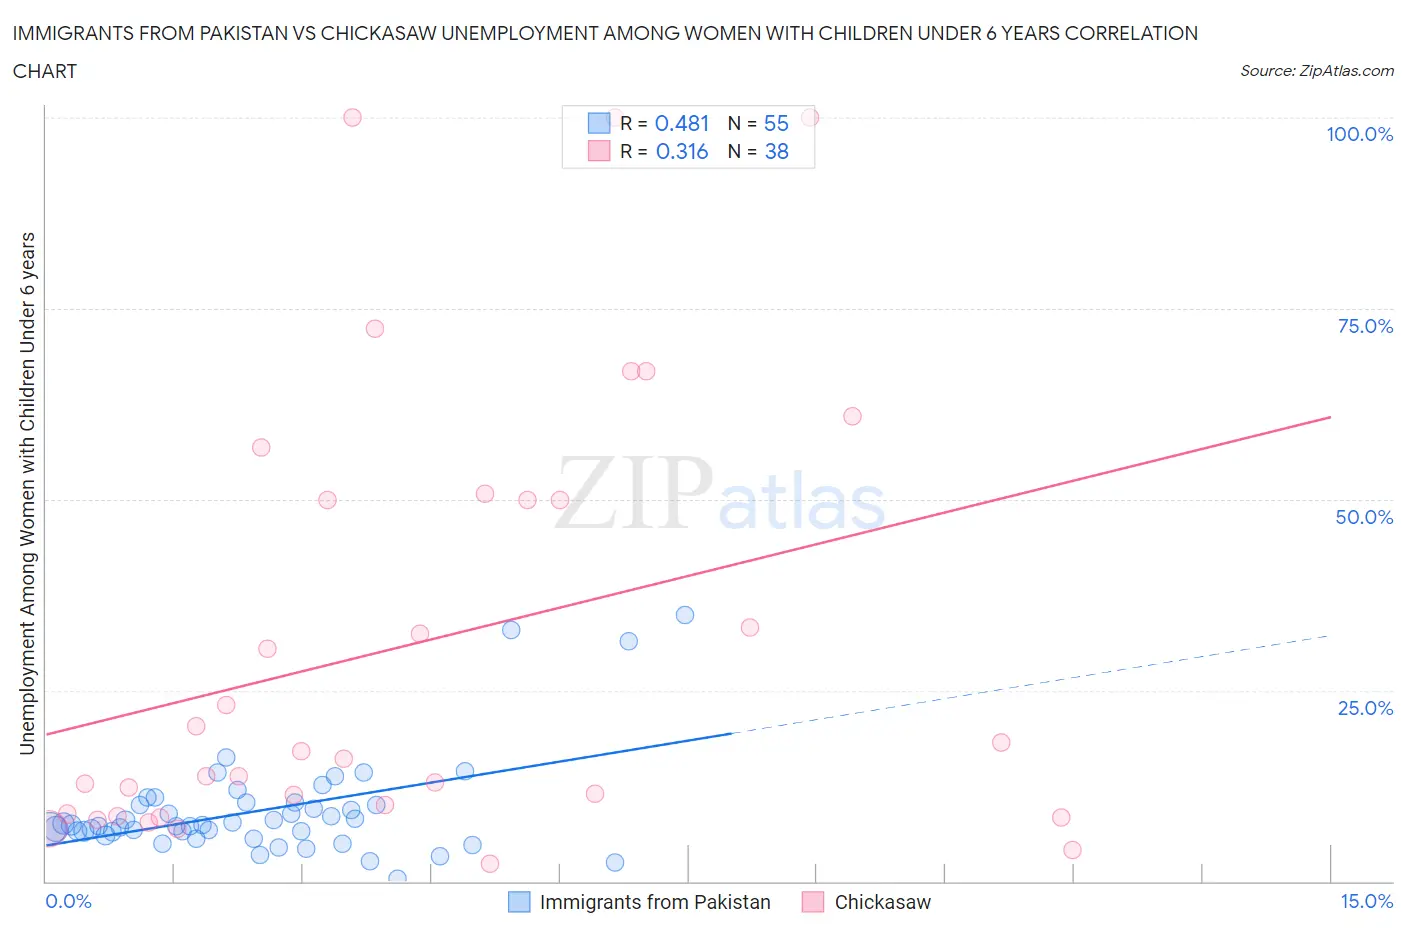
Immigrants from Pakistan vs Chickasaw Unemployment Among Women with Children Under 6 years Correlation Chart
The statistical analysis conducted on geographies consisting of 233,137,568 people shows a moderate positive correlation between the proportion of Immigrants from Pakistan and unemployment rate among women with children under the age of 6 in the United States with a correlation coefficient (R) of 0.481 and weighted average of 7.2%. Similarly, the statistical analysis conducted on geographies consisting of 128,741,531 people shows a mild positive correlation between the proportion of Chickasaw and unemployment rate among women with children under the age of 6 in the United States with a correlation coefficient (R) of 0.316 and weighted average of 9.0%, a difference of 24.5%.
Unemployment Among Women with Children Under 6 years Correlation Summary
| Measurement | Immigrants from Pakistan | Chickasaw |
| Minimum | 0.40% | 2.2% |
| Maximum | 34.9% | 100.0% |
| Range | 34.5% | 97.8% |
| Mean | 9.2% | 31.1% |
| Median | 7.3% | 16.5% |
| Interquartile 25% (IQ1) | 6.5% | 8.8% |
| Interquartile 75% (IQ3) | 10.3% | 50.0% |
| Interquartile Range (IQR) | 3.8% | 41.2% |
| Standard Deviation (Sample) | 6.6% | 28.9% |
| Standard Deviation (Population) | 6.6% | 28.5% |
Similar Demographics by Unemployment Among Women with Children Under 6 years
Demographics Similar to Immigrants from Pakistan by Unemployment Among Women with Children Under 6 years
In terms of unemployment among women with children under 6 years, the demographic groups most similar to Immigrants from Pakistan are Venezuelan (7.2%, a difference of 0.010%), Immigrants from Kazakhstan (7.2%, a difference of 0.020%), Immigrants from Egypt (7.2%, a difference of 0.030%), Immigrants from Saudi Arabia (7.2%, a difference of 0.10%), and Immigrants from Nicaragua (7.2%, a difference of 0.11%).
| Demographics | Rating | Rank | Unemployment Among Women with Children Under 6 years |
| Immigrants | Europe | 97.5 /100 | #99 | Exceptional 7.2% |
| Immigrants | Northern Europe | 97.4 /100 | #100 | Exceptional 7.2% |
| Chileans | 97.4 /100 | #101 | Exceptional 7.2% |
| Immigrants | Nicaragua | 97.3 /100 | #102 | Exceptional 7.2% |
| Immigrants | Saudi Arabia | 97.3 /100 | #103 | Exceptional 7.2% |
| Immigrants | Egypt | 97.2 /100 | #104 | Exceptional 7.2% |
| Venezuelans | 97.2 /100 | #105 | Exceptional 7.2% |
| Immigrants | Pakistan | 97.2 /100 | #106 | Exceptional 7.2% |
| Immigrants | Kazakhstan | 97.1 /100 | #107 | Exceptional 7.2% |
| Eastern Europeans | 96.9 /100 | #108 | Exceptional 7.2% |
| Australians | 96.9 /100 | #109 | Exceptional 7.2% |
| Palestinians | 96.8 /100 | #110 | Exceptional 7.2% |
| Norwegians | 96.7 /100 | #111 | Exceptional 7.2% |
| Israelis | 96.5 /100 | #112 | Exceptional 7.2% |
| Nicaraguans | 96.3 /100 | #113 | Exceptional 7.2% |
Demographics Similar to Chickasaw by Unemployment Among Women with Children Under 6 years
In terms of unemployment among women with children under 6 years, the demographic groups most similar to Chickasaw are Creek (8.9%, a difference of 0.53%), Immigrants from Jamaica (8.9%, a difference of 0.62%), Tlingit-Haida (8.9%, a difference of 0.83%), Hispanic or Latino (9.0%, a difference of 0.89%), and Immigrants from West Indies (9.0%, a difference of 0.91%).
| Demographics | Rating | Rank | Unemployment Among Women with Children Under 6 years |
| Immigrants | Nonimmigrants | 0.0 /100 | #294 | Tragic 8.8% |
| Immigrants | Central America | 0.0 /100 | #295 | Tragic 8.9% |
| Immigrants | Dominican Republic | 0.0 /100 | #296 | Tragic 8.9% |
| Mexicans | 0.0 /100 | #297 | Tragic 8.9% |
| Tlingit-Haida | 0.0 /100 | #298 | Tragic 8.9% |
| Immigrants | Jamaica | 0.0 /100 | #299 | Tragic 8.9% |
| Creek | 0.0 /100 | #300 | Tragic 8.9% |
| Chickasaw | 0.0 /100 | #301 | Tragic 9.0% |
| Hispanics or Latinos | 0.0 /100 | #302 | Tragic 9.0% |
| Immigrants | West Indies | 0.0 /100 | #303 | Tragic 9.0% |
| Immigrants | Mexico | 0.0 /100 | #304 | Tragic 9.1% |
| Alaskan Athabascans | 0.0 /100 | #305 | Tragic 9.1% |
| Pueblo | 0.0 /100 | #306 | Tragic 9.1% |
| Dominicans | 0.0 /100 | #307 | Tragic 9.1% |
| Immigrants | Micronesia | 0.0 /100 | #308 | Tragic 9.1% |