Immigrants from Norway vs Immigrants from Japan Unemployment Among Ages 55 to 59 years
COMPARE
Immigrants from Norway
Immigrants from Japan
Unemployment Among Ages 55 to 59 years
Unemployment Among Ages 55 to 59 years Comparison
Immigrants from Norway
Immigrants from Japan
4.8%
UNEMPLOYMENT AMONG AGES 55 TO 59 YEARS
79.8/ 100
METRIC RATING
142nd/ 347
METRIC RANK
4.7%
UNEMPLOYMENT AMONG AGES 55 TO 59 YEARS
89.4/ 100
METRIC RATING
123rd/ 347
METRIC RANK
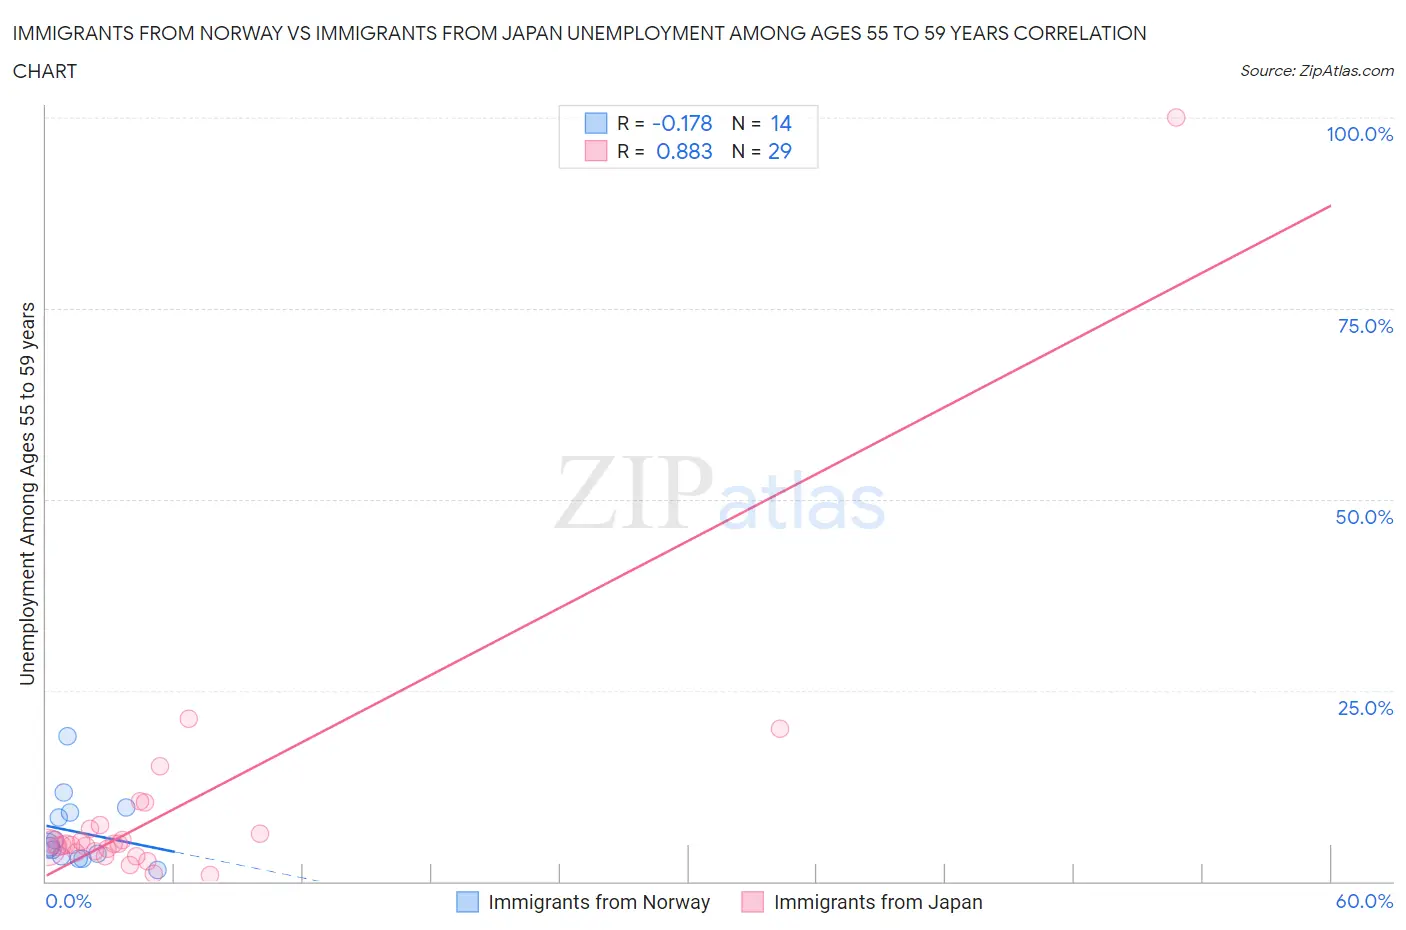
Immigrants from Norway vs Immigrants from Japan Unemployment Among Ages 55 to 59 years Correlation Chart
The statistical analysis conducted on geographies consisting of 114,004,203 people shows a poor negative correlation between the proportion of Immigrants from Norway and unemployment rate among population between the ages 55 and 59 in the United States with a correlation coefficient (R) of -0.178 and weighted average of 4.8%. Similarly, the statistical analysis conducted on geographies consisting of 320,972,044 people shows a very strong positive correlation between the proportion of Immigrants from Japan and unemployment rate among population between the ages 55 and 59 in the United States with a correlation coefficient (R) of 0.883 and weighted average of 4.7%, a difference of 0.79%.
Unemployment Among Ages 55 to 59 years Correlation Summary
| Measurement | Immigrants from Norway | Immigrants from Japan |
| Minimum | 1.4% | 0.90% |
| Maximum | 19.0% | 100.0% |
| Range | 17.6% | 99.1% |
| Mean | 6.5% | 9.5% |
| Median | 4.6% | 4.8% |
| Interquartile 25% (IQ1) | 3.3% | 3.9% |
| Interquartile 75% (IQ3) | 9.0% | 7.1% |
| Interquartile Range (IQR) | 5.7% | 3.2% |
| Standard Deviation (Sample) | 4.7% | 18.1% |
| Standard Deviation (Population) | 4.5% | 17.8% |
Demographics Similar to Immigrants from Norway and Immigrants from Japan by Unemployment Among Ages 55 to 59 years
In terms of unemployment among ages 55 to 59 years, the demographic groups most similar to Immigrants from Norway are French Canadian (4.8%, a difference of 0.020%), Immigrants from Indonesia (4.8%, a difference of 0.030%), Romanian (4.7%, a difference of 0.20%), Immigrants from Switzerland (4.7%, a difference of 0.21%), and Colombian (4.7%, a difference of 0.26%). Similarly, the demographic groups most similar to Immigrants from Japan are Immigrants from Afghanistan (4.7%, a difference of 0.010%), Lithuanian (4.7%, a difference of 0.060%), Immigrants from Malaysia (4.7%, a difference of 0.16%), Immigrants from Serbia (4.7%, a difference of 0.17%), and Icelander (4.7%, a difference of 0.18%).
| Demographics | Rating | Rank | Unemployment Among Ages 55 to 59 years |
| Immigrants | Afghanistan | 89.5 /100 | #122 | Excellent 4.7% |
| Immigrants | Japan | 89.4 /100 | #123 | Excellent 4.7% |
| Lithuanians | 88.8 /100 | #124 | Excellent 4.7% |
| Immigrants | Malaysia | 87.9 /100 | #125 | Excellent 4.7% |
| Immigrants | Serbia | 87.8 /100 | #126 | Excellent 4.7% |
| Icelanders | 87.7 /100 | #127 | Excellent 4.7% |
| Pennsylvania Germans | 87.1 /100 | #128 | Excellent 4.7% |
| Immigrants | Sweden | 86.8 /100 | #129 | Excellent 4.7% |
| Greeks | 86.6 /100 | #130 | Excellent 4.7% |
| Immigrants | Thailand | 85.4 /100 | #131 | Excellent 4.7% |
| Immigrants | Romania | 85.3 /100 | #132 | Excellent 4.7% |
| Immigrants | Netherlands | 84.5 /100 | #133 | Excellent 4.7% |
| Panamanians | 84.1 /100 | #134 | Excellent 4.7% |
| Slavs | 83.7 /100 | #135 | Excellent 4.7% |
| Colombians | 83.6 /100 | #136 | Excellent 4.7% |
| Delaware | 83.6 /100 | #137 | Excellent 4.7% |
| Immigrants | Switzerland | 82.9 /100 | #138 | Excellent 4.7% |
| Romanians | 82.7 /100 | #139 | Excellent 4.7% |
| Immigrants | Indonesia | 80.2 /100 | #140 | Excellent 4.8% |
| French Canadians | 80.1 /100 | #141 | Excellent 4.8% |
| Immigrants | Norway | 79.8 /100 | #142 | Good 4.8% |