Barbadian vs Immigrants from Sudan Unemployment Among Ages 55 to 59 years
COMPARE
Barbadian
Immigrants from Sudan
Unemployment Among Ages 55 to 59 years
Unemployment Among Ages 55 to 59 years Comparison
Barbadians
Immigrants from Sudan
5.3%
UNEMPLOYMENT AMONG AGES 55 TO 59 YEARS
0.0/ 100
METRIC RATING
296th/ 347
METRIC RANK
4.8%
UNEMPLOYMENT AMONG AGES 55 TO 59 YEARS
58.4/ 100
METRIC RATING
169th/ 347
METRIC RANK
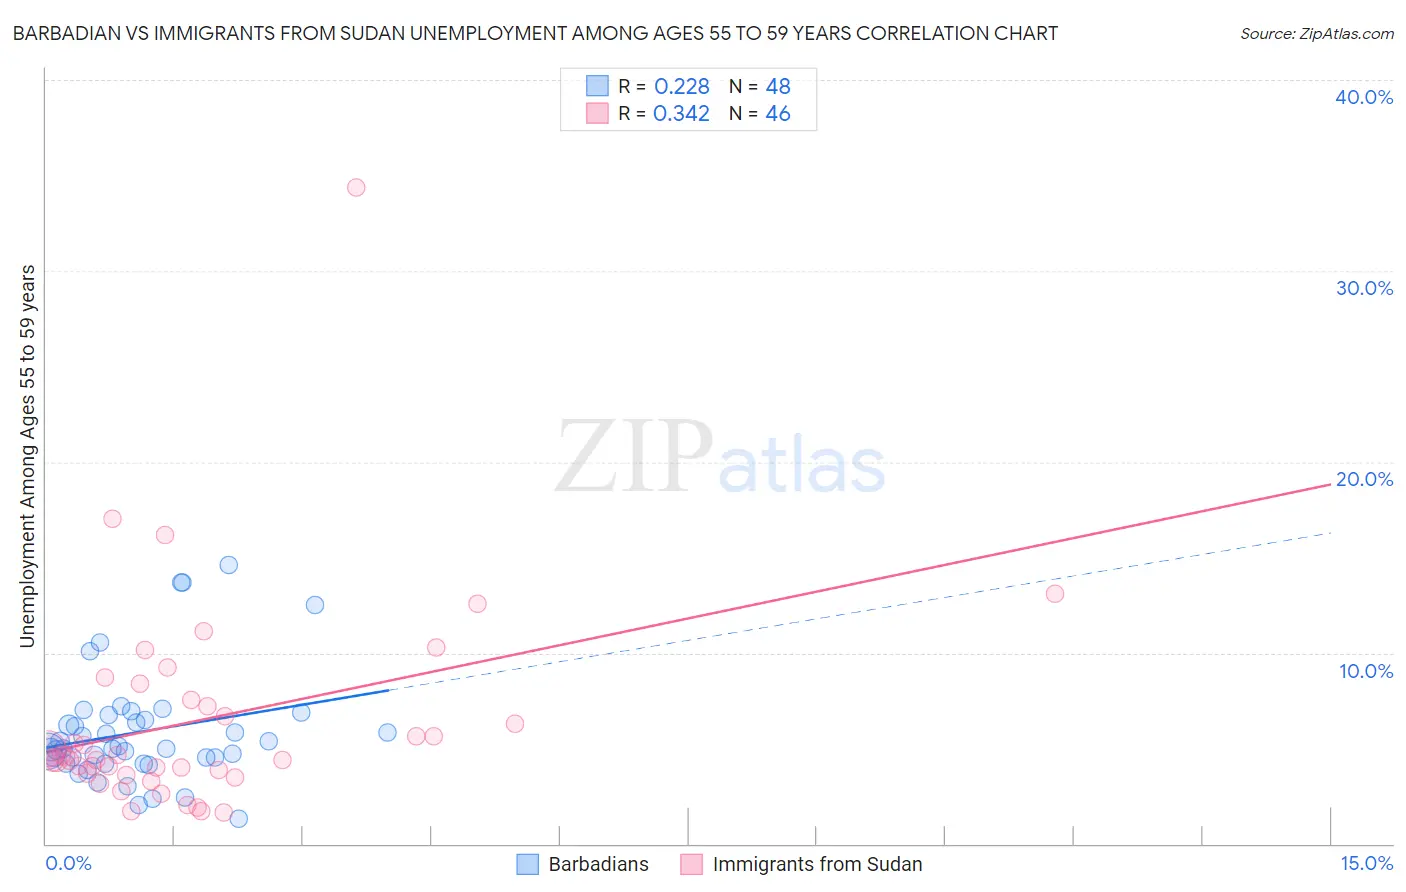
Barbadian vs Immigrants from Sudan Unemployment Among Ages 55 to 59 years Correlation Chart
The statistical analysis conducted on geographies consisting of 137,668,651 people shows a weak positive correlation between the proportion of Barbadians and unemployment rate among population between the ages 55 and 59 in the United States with a correlation coefficient (R) of 0.228 and weighted average of 5.3%. Similarly, the statistical analysis conducted on geographies consisting of 116,851,236 people shows a mild positive correlation between the proportion of Immigrants from Sudan and unemployment rate among population between the ages 55 and 59 in the United States with a correlation coefficient (R) of 0.342 and weighted average of 4.8%, a difference of 11.1%.
Unemployment Among Ages 55 to 59 years Correlation Summary
| Measurement | Barbadian | Immigrants from Sudan |
| Minimum | 1.3% | 1.6% |
| Maximum | 14.6% | 34.4% |
| Range | 13.3% | 32.8% |
| Mean | 5.9% | 6.5% |
| Median | 5.0% | 4.5% |
| Interquartile 25% (IQ1) | 4.4% | 3.7% |
| Interquartile 75% (IQ3) | 6.6% | 7.5% |
| Interquartile Range (IQR) | 2.3% | 3.8% |
| Standard Deviation (Sample) | 2.9% | 5.6% |
| Standard Deviation (Population) | 2.9% | 5.5% |
Similar Demographics by Unemployment Among Ages 55 to 59 years
Demographics Similar to Barbadians by Unemployment Among Ages 55 to 59 years
In terms of unemployment among ages 55 to 59 years, the demographic groups most similar to Barbadians are Dutch West Indian (5.3%, a difference of 0.040%), Cajun (5.3%, a difference of 0.16%), Immigrants from Mexico (5.3%, a difference of 0.22%), Immigrants from Grenada (5.3%, a difference of 0.28%), and British West Indian (5.3%, a difference of 0.47%).
| Demographics | Rating | Rank | Unemployment Among Ages 55 to 59 years |
| Immigrants | Central America | 0.0 /100 | #289 | Tragic 5.3% |
| Sioux | 0.0 /100 | #290 | Tragic 5.3% |
| Trinidadians and Tobagonians | 0.0 /100 | #291 | Tragic 5.3% |
| British West Indians | 0.0 /100 | #292 | Tragic 5.3% |
| Immigrants | Grenada | 0.0 /100 | #293 | Tragic 5.3% |
| Cajuns | 0.0 /100 | #294 | Tragic 5.3% |
| Dutch West Indians | 0.0 /100 | #295 | Tragic 5.3% |
| Barbadians | 0.0 /100 | #296 | Tragic 5.3% |
| Immigrants | Mexico | 0.0 /100 | #297 | Tragic 5.3% |
| Hispanics or Latinos | 0.0 /100 | #298 | Tragic 5.4% |
| Cape Verdeans | 0.0 /100 | #299 | Tragic 5.4% |
| Immigrants | St. Vincent and the Grenadines | 0.0 /100 | #300 | Tragic 5.4% |
| Immigrants | Dominica | 0.0 /100 | #301 | Tragic 5.5% |
| Sierra Leoneans | 0.0 /100 | #302 | Tragic 5.5% |
| Marshallese | 0.0 /100 | #303 | Tragic 5.5% |
Demographics Similar to Immigrants from Sudan by Unemployment Among Ages 55 to 59 years
In terms of unemployment among ages 55 to 59 years, the demographic groups most similar to Immigrants from Sudan are Immigrants from Cambodia (4.8%, a difference of 0.040%), Immigrants from Western Europe (4.8%, a difference of 0.080%), Uruguayan (4.8%, a difference of 0.12%), Immigrants from France (4.8%, a difference of 0.15%), and Potawatomi (4.8%, a difference of 0.15%).
| Demographics | Rating | Rank | Unemployment Among Ages 55 to 59 years |
| Immigrants | Africa | 64.2 /100 | #162 | Good 4.8% |
| Immigrants | Lebanon | 63.8 /100 | #163 | Good 4.8% |
| Americans | 63.3 /100 | #164 | Good 4.8% |
| Immigrants | France | 62.0 /100 | #165 | Good 4.8% |
| Potawatomi | 62.0 /100 | #166 | Good 4.8% |
| Immigrants | Western Europe | 60.4 /100 | #167 | Good 4.8% |
| Immigrants | Cambodia | 59.3 /100 | #168 | Average 4.8% |
| Immigrants | Sudan | 58.4 /100 | #169 | Average 4.8% |
| Uruguayans | 55.6 /100 | #170 | Average 4.8% |
| Japanese | 54.5 /100 | #171 | Average 4.8% |
| Nicaraguans | 54.0 /100 | #172 | Average 4.8% |
| Immigrants | Eastern Europe | 52.2 /100 | #173 | Average 4.8% |
| Immigrants | Croatia | 50.0 /100 | #174 | Average 4.8% |
| Australians | 48.6 /100 | #175 | Average 4.8% |
| Samoans | 47.1 /100 | #176 | Average 4.8% |