Immigrants from North Macedonia vs Choctaw Unemployment Among Ages 30 to 34 years
COMPARE
Immigrants from North Macedonia
Choctaw
Unemployment Among Ages 30 to 34 years
Unemployment Among Ages 30 to 34 years Comparison
Immigrants from North Macedonia
Choctaw
5.2%
UNEMPLOYMENT AMONG AGES 30 TO 34 YEARS
90.9/ 100
METRIC RATING
98th/ 347
METRIC RANK
6.4%
UNEMPLOYMENT AMONG AGES 30 TO 34 YEARS
0.0/ 100
METRIC RATING
285th/ 347
METRIC RANK
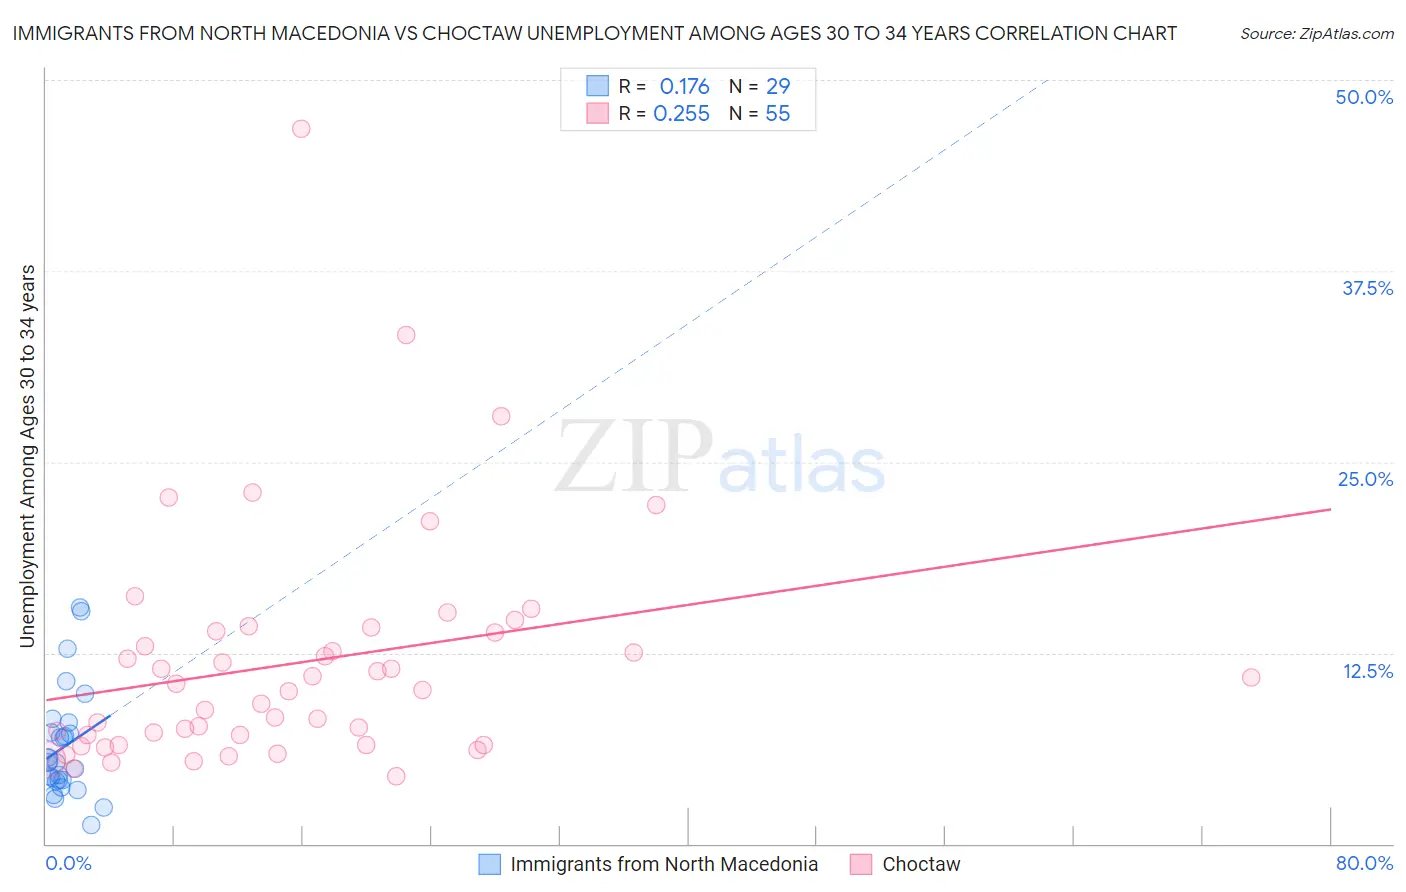
Immigrants from North Macedonia vs Choctaw Unemployment Among Ages 30 to 34 years Correlation Chart
The statistical analysis conducted on geographies consisting of 72,707,870 people shows a poor positive correlation between the proportion of Immigrants from North Macedonia and unemployment rate among population between the ages 30 and 34 in the United States with a correlation coefficient (R) of 0.176 and weighted average of 5.2%. Similarly, the statistical analysis conducted on geographies consisting of 257,078,627 people shows a weak positive correlation between the proportion of Choctaw and unemployment rate among population between the ages 30 and 34 in the United States with a correlation coefficient (R) of 0.255 and weighted average of 6.4%, a difference of 22.6%.
Unemployment Among Ages 30 to 34 years Correlation Summary
| Measurement | Immigrants from North Macedonia | Choctaw |
| Minimum | 1.2% | 4.4% |
| Maximum | 15.5% | 46.8% |
| Range | 14.3% | 42.4% |
| Mean | 6.4% | 11.8% |
| Median | 5.3% | 10.1% |
| Interquartile 25% (IQ1) | 4.1% | 6.5% |
| Interquartile 75% (IQ3) | 7.6% | 13.9% |
| Interquartile Range (IQR) | 3.5% | 7.4% |
| Standard Deviation (Sample) | 3.5% | 7.7% |
| Standard Deviation (Population) | 3.5% | 7.6% |
Similar Demographics by Unemployment Among Ages 30 to 34 years
Demographics Similar to Immigrants from North Macedonia by Unemployment Among Ages 30 to 34 years
In terms of unemployment among ages 30 to 34 years, the demographic groups most similar to Immigrants from North Macedonia are Immigrants from Ireland (5.2%, a difference of 0.070%), European (5.2%, a difference of 0.18%), Mongolian (5.2%, a difference of 0.19%), Immigrants from Czechoslovakia (5.3%, a difference of 0.27%), and Kenyan (5.2%, a difference of 0.28%).
| Demographics | Rating | Rank | Unemployment Among Ages 30 to 34 years |
| Iraqis | 92.6 /100 | #91 | Exceptional 5.2% |
| Immigrants | Argentina | 92.5 /100 | #92 | Exceptional 5.2% |
| Laotians | 92.4 /100 | #93 | Exceptional 5.2% |
| Maltese | 92.3 /100 | #94 | Exceptional 5.2% |
| Kenyans | 92.1 /100 | #95 | Exceptional 5.2% |
| Mongolians | 91.7 /100 | #96 | Exceptional 5.2% |
| Europeans | 91.7 /100 | #97 | Exceptional 5.2% |
| Immigrants | North Macedonia | 90.9 /100 | #98 | Exceptional 5.2% |
| Immigrants | Ireland | 90.6 /100 | #99 | Exceptional 5.2% |
| Immigrants | Czechoslovakia | 89.5 /100 | #100 | Excellent 5.3% |
| British | 89.1 /100 | #101 | Excellent 5.3% |
| Immigrants | Switzerland | 88.8 /100 | #102 | Excellent 5.3% |
| Immigrants | Jordan | 88.8 /100 | #103 | Excellent 5.3% |
| Northern Europeans | 87.9 /100 | #104 | Excellent 5.3% |
| Argentineans | 87.9 /100 | #105 | Excellent 5.3% |
Demographics Similar to Choctaw by Unemployment Among Ages 30 to 34 years
In terms of unemployment among ages 30 to 34 years, the demographic groups most similar to Choctaw are Central American Indian (6.4%, a difference of 0.040%), Immigrants from West Indies (6.4%, a difference of 0.060%), Immigrants from Bangladesh (6.4%, a difference of 0.10%), Senegalese (6.4%, a difference of 0.10%), and Menominee (6.4%, a difference of 0.14%).
| Demographics | Rating | Rank | Unemployment Among Ages 30 to 34 years |
| Osage | 0.0 /100 | #278 | Tragic 6.3% |
| Cree | 0.0 /100 | #279 | Tragic 6.4% |
| Cherokee | 0.0 /100 | #280 | Tragic 6.4% |
| Immigrants | Caribbean | 0.0 /100 | #281 | Tragic 6.4% |
| Africans | 0.0 /100 | #282 | Tragic 6.4% |
| Hispanics or Latinos | 0.0 /100 | #283 | Tragic 6.4% |
| Immigrants | Bangladesh | 0.0 /100 | #284 | Tragic 6.4% |
| Choctaw | 0.0 /100 | #285 | Tragic 6.4% |
| Central American Indians | 0.0 /100 | #286 | Tragic 6.4% |
| Immigrants | West Indies | 0.0 /100 | #287 | Tragic 6.4% |
| Senegalese | 0.0 /100 | #288 | Tragic 6.4% |
| Menominee | 0.0 /100 | #289 | Tragic 6.4% |
| Immigrants | Trinidad and Tobago | 0.0 /100 | #290 | Tragic 6.5% |
| Jamaicans | 0.0 /100 | #291 | Tragic 6.5% |
| Vietnamese | 0.0 /100 | #292 | Tragic 6.5% |