Immigrants from North Macedonia vs Albanian Unemployment Among Ages 30 to 34 years
COMPARE
Immigrants from North Macedonia
Albanian
Unemployment Among Ages 30 to 34 years
Unemployment Among Ages 30 to 34 years Comparison
Immigrants from North Macedonia
Albanians
5.2%
UNEMPLOYMENT AMONG AGES 30 TO 34 YEARS
90.9/ 100
METRIC RATING
98th/ 347
METRIC RANK
5.4%
UNEMPLOYMENT AMONG AGES 30 TO 34 YEARS
63.7/ 100
METRIC RATING
157th/ 347
METRIC RANK
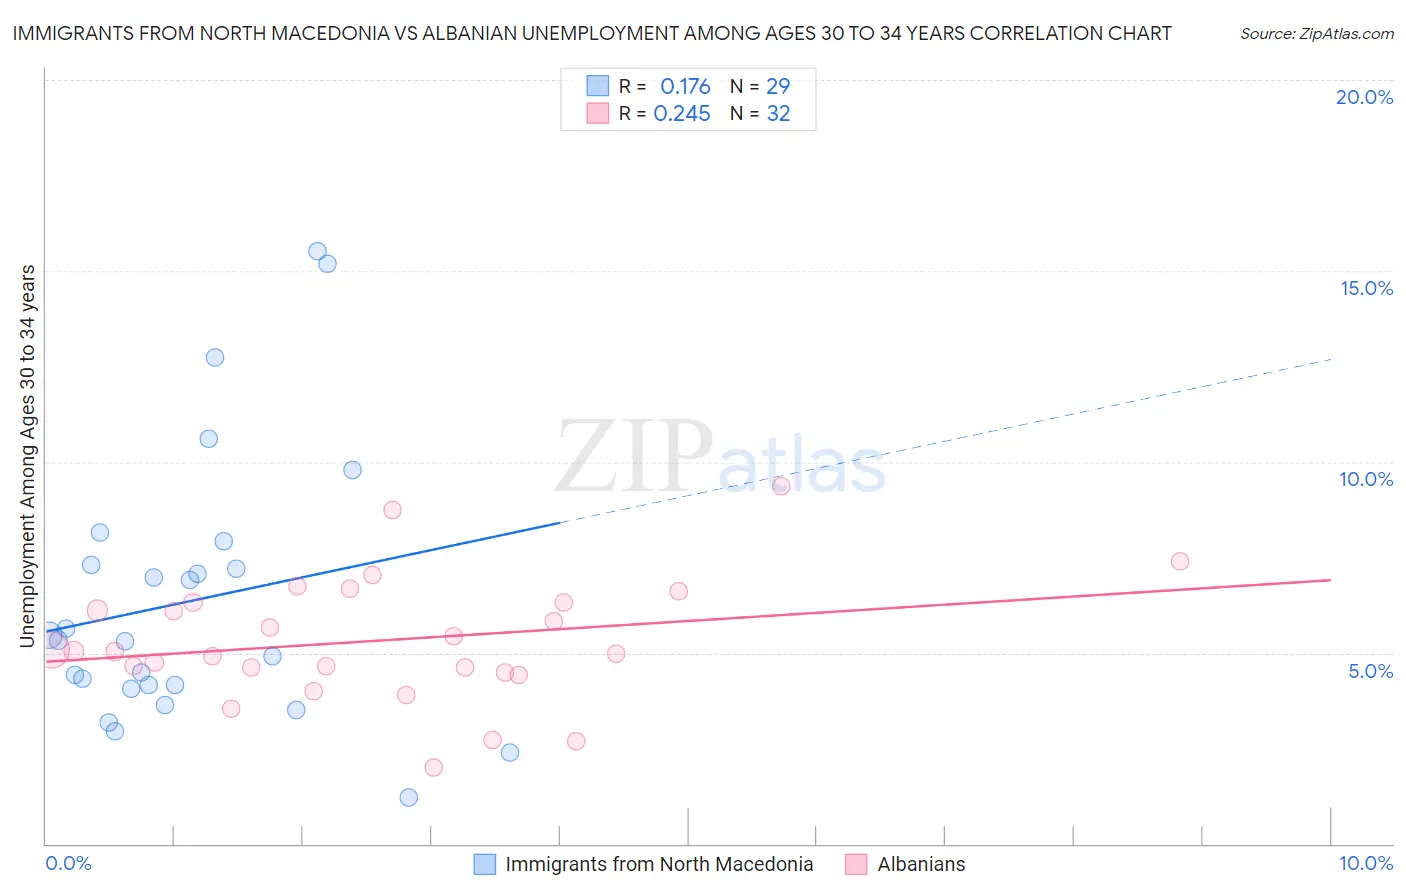
Immigrants from North Macedonia vs Albanian Unemployment Among Ages 30 to 34 years Correlation Chart
The statistical analysis conducted on geographies consisting of 72,707,870 people shows a poor positive correlation between the proportion of Immigrants from North Macedonia and unemployment rate among population between the ages 30 and 34 in the United States with a correlation coefficient (R) of 0.176 and weighted average of 5.2%. Similarly, the statistical analysis conducted on geographies consisting of 186,030,176 people shows a weak positive correlation between the proportion of Albanians and unemployment rate among population between the ages 30 and 34 in the United States with a correlation coefficient (R) of 0.245 and weighted average of 5.4%, a difference of 3.1%.
Unemployment Among Ages 30 to 34 years Correlation Summary
| Measurement | Immigrants from North Macedonia | Albanian |
| Minimum | 1.2% | 2.0% |
| Maximum | 15.5% | 9.4% |
| Range | 14.3% | 7.4% |
| Mean | 6.4% | 5.3% |
| Median | 5.3% | 5.0% |
| Interquartile 25% (IQ1) | 4.1% | 4.6% |
| Interquartile 75% (IQ3) | 7.6% | 6.3% |
| Interquartile Range (IQR) | 3.5% | 1.8% |
| Standard Deviation (Sample) | 3.5% | 1.6% |
| Standard Deviation (Population) | 3.5% | 1.6% |
Similar Demographics by Unemployment Among Ages 30 to 34 years
Demographics Similar to Immigrants from North Macedonia by Unemployment Among Ages 30 to 34 years
In terms of unemployment among ages 30 to 34 years, the demographic groups most similar to Immigrants from North Macedonia are Immigrants from Ireland (5.2%, a difference of 0.070%), European (5.2%, a difference of 0.18%), Mongolian (5.2%, a difference of 0.19%), Immigrants from Czechoslovakia (5.3%, a difference of 0.27%), and Kenyan (5.2%, a difference of 0.28%).
| Demographics | Rating | Rank | Unemployment Among Ages 30 to 34 years |
| Iraqis | 92.6 /100 | #91 | Exceptional 5.2% |
| Immigrants | Argentina | 92.5 /100 | #92 | Exceptional 5.2% |
| Laotians | 92.4 /100 | #93 | Exceptional 5.2% |
| Maltese | 92.3 /100 | #94 | Exceptional 5.2% |
| Kenyans | 92.1 /100 | #95 | Exceptional 5.2% |
| Mongolians | 91.7 /100 | #96 | Exceptional 5.2% |
| Europeans | 91.7 /100 | #97 | Exceptional 5.2% |
| Immigrants | North Macedonia | 90.9 /100 | #98 | Exceptional 5.2% |
| Immigrants | Ireland | 90.6 /100 | #99 | Exceptional 5.2% |
| Immigrants | Czechoslovakia | 89.5 /100 | #100 | Excellent 5.3% |
| British | 89.1 /100 | #101 | Excellent 5.3% |
| Immigrants | Switzerland | 88.8 /100 | #102 | Excellent 5.3% |
| Immigrants | Jordan | 88.8 /100 | #103 | Excellent 5.3% |
| Northern Europeans | 87.9 /100 | #104 | Excellent 5.3% |
| Argentineans | 87.9 /100 | #105 | Excellent 5.3% |
Demographics Similar to Albanians by Unemployment Among Ages 30 to 34 years
In terms of unemployment among ages 30 to 34 years, the demographic groups most similar to Albanians are Czechoslovakian (5.4%, a difference of 0.010%), Immigrants from Belarus (5.4%, a difference of 0.070%), Immigrants from Hungary (5.4%, a difference of 0.19%), Immigrants from Croatia (5.4%, a difference of 0.20%), and Immigrants from South Eastern Asia (5.4%, a difference of 0.22%).
| Demographics | Rating | Rank | Unemployment Among Ages 30 to 34 years |
| Colombians | 68.7 /100 | #150 | Good 5.4% |
| Immigrants | Oceania | 68.1 /100 | #151 | Good 5.4% |
| Lebanese | 67.2 /100 | #152 | Good 5.4% |
| Immigrants | South Eastern Asia | 66.5 /100 | #153 | Good 5.4% |
| South Africans | 66.5 /100 | #154 | Good 5.4% |
| Immigrants | Hungary | 66.1 /100 | #155 | Good 5.4% |
| Czechoslovakians | 63.7 /100 | #156 | Good 5.4% |
| Albanians | 63.7 /100 | #157 | Good 5.4% |
| Immigrants | Belarus | 62.7 /100 | #158 | Good 5.4% |
| Immigrants | Croatia | 61.0 /100 | #159 | Good 5.4% |
| Immigrants | Scotland | 59.3 /100 | #160 | Average 5.4% |
| Austrians | 59.0 /100 | #161 | Average 5.4% |
| Brazilians | 58.2 /100 | #162 | Average 5.4% |
| Arabs | 57.7 /100 | #163 | Average 5.4% |
| Basques | 57.3 /100 | #164 | Average 5.4% |