Malaysian vs Choctaw Unemployment Among Ages 30 to 34 years

COMPARE

Malaysian
Race
Ancestry
AfghanAfricanAlaska NativeAlaskan AthabascanAlbanianAleutAlsatianAmericanApacheArabArapahoArgentineanArmenianAssyrian/Chaldean/SyriacAustralianAustrianBahamianBangladeshiBarbadianBasqueBelgianBelizeanBermudanBhutaneseBlackfeetBolivianBrazilianBritishBritish West IndianBulgarianBurmeseCajunCambodianCanadianCape VerdeanCarpatho RusynCelticCentral AmericanCentral American IndianCherokeeCheyenneChickasawChileanChineseChippewaColombianColvilleComancheCosta RicanCreeCreekCroatianCrowCubanCypriotCzechCzechoslovakianDanishDelawareDominicanDutchDutch West IndianEastern EuropeanEcuadorianEgyptianEnglishEstonianEthiopianEuropeanFijianFilipinoFinnishFrenchFrench American IndianFrench CanadianGermanGerman RussianGhanaianGreekGuamanian/ChamorroGuatemalanGuyaneseHaitianHmongHonduranHopiHoumaHungarianIcelanderIndian (Asian)IndonesianInupiatIranianIraqiIrishIroquoisIsraeliItalianJamaicanJapaneseJordanianKenyanKiowaKoreanLaotianLatvianLebaneseLiberianLithuanianLumbeeLuxembourgerMacedonianMalaysianMalteseMarshalleseMenomineeMexicanMexican American IndianMongolianMoroccanNative HawaiianNavajoNepaleseNew ZealanderNicaraguanNigerianNorthern EuropeanNorwegianOkinawanOsageOttawaPaiutePakistaniPalestinianPanamanianParaguayanPennsylvania GermanPeruvianPimaPolishPortuguesePotawatomiPuebloPuerto RicanPuget Sound SalishRomanianRussianSalvadoranSamoanScandinavianScotch-IrishScottishSeminoleSenegaleseSerbianShoshoneSierra LeoneanSiouxSlavicSlovakSloveneSomaliSouth AfricanSouth AmericanSouth American IndianSoviet UnionSpaniardSpanishSpanish AmericanSpanish American IndianSri LankanSubsaharan AfricanSudaneseSwedishSwissSyrianTaiwaneseThaiTlingit-HaidaTohono O'OdhamTonganTrinidadian and TobagonianTsimshianTurkishU.S. Virgin IslanderUgandanUkrainianUruguayanUteVenezuelanVietnameseWelshWest IndianYakamaYaquiYugoslavianYumanYup'ikZimbabwean
Immigration
NonimmigrantsImmigrantsAfghanistanAfricaAlbaniaArgentinaArmeniaAsiaAustraliaAustriaBahamasBangladeshBarbadosBelarusBelgiumBelizeBoliviaBosnia and HerzegovinaBrazilBulgariaBurma/MyanmarCabo VerdeCambodiaCameroonCanadaCaribbeanCentral AmericaChileChinaColombiaCongoCosta RicaCroatiaCubaCzechoslovakiaDenmarkDominicaDominican RepublicEastern AfricaEastern AsiaEastern EuropeEcuadorEgyptEl SalvadorEnglandEritreaEthiopiaEuropeFijiFranceGermanyGhanaGreeceGrenadaGuatemalaGuyanaHaitiHondurasHong KongHungaryIndiaIndonesiaIranIraqIrelandIsraelItalyJamaicaJapanJordanKazakhstanKenyaKoreaKuwaitLaosLatin AmericaLatviaLebanonLiberiaLithuaniaMalaysiaMexicoMicronesiaMiddle AfricaMoldovaMoroccoNepalNetherlandsNicaraguaNigeriaNorth AmericaNorth MacedoniaNorthern AfricaNorthern EuropeNorwayOceaniaPakistanPanamaPeruPhilippinesPolandPortugalRomaniaRussiaSaudi ArabiaScotlandSenegalSerbiaSierra LeoneSingaporeSomaliaSouth AfricaSouth AmericaSouth Central AsiaSouth Eastern AsiaSouthern EuropeSpainSri LankaSt. Vincent and the GrenadinesSudanSwedenSwitzerlandSyriaTaiwanThailandTrinidad and TobagoTurkeyUgandaUkraineUruguayUzbekistanVenezuelaVietnamWest IndiesWestern AfricaWestern AsiaWestern EuropeYemenZaireZimbabweAzores
Choctaw
Race
Ancestry
AfghanAfricanAlaska NativeAlaskan AthabascanAlbanianAleutAlsatianAmericanApacheArabArapahoArgentineanArmenianAssyrian/Chaldean/SyriacAustralianAustrianBahamianBangladeshiBarbadianBasqueBelgianBelizeanBermudanBhutaneseBlackfeetBolivianBrazilianBritishBritish West IndianBulgarianBurmeseCajunCambodianCanadianCape VerdeanCarpatho RusynCelticCentral AmericanCentral American IndianCherokeeCheyenneChickasawChileanChineseChippewaChoctawColombianColvilleComancheCosta RicanCreeCreekCroatianCrowCubanCypriotCzechCzechoslovakianDanishDelawareDominicanDutchDutch West IndianEastern EuropeanEcuadorianEgyptianEnglishEstonianEthiopianEuropeanFijianFilipinoFinnishFrenchFrench American IndianFrench CanadianGermanGerman RussianGhanaianGreekGuamanian/ChamorroGuatemalanGuyaneseHaitianHmongHonduranHopiHoumaHungarianIcelanderIndian (Asian)IndonesianInupiatIranianIraqiIrishIroquoisIsraeliItalianJamaicanJapaneseJordanianKenyanKiowaKoreanLaotianLatvianLebaneseLiberianLithuanianLumbeeLuxembourgerMacedonianMalteseMarshalleseMenomineeMexicanMexican American IndianMongolianMoroccanNative HawaiianNavajoNepaleseNew ZealanderNicaraguanNigerianNorthern EuropeanNorwegianOkinawanOsageOttawaPaiutePakistaniPalestinianPanamanianParaguayanPennsylvania GermanPeruvianPimaPolishPortuguesePotawatomiPuebloPuerto RicanPuget Sound SalishRomanianRussianSalvadoranSamoanScandinavianScotch-IrishScottishSeminoleSenegaleseSerbianShoshoneSierra LeoneanSiouxSlavicSlovakSloveneSomaliSouth AfricanSouth AmericanSouth American IndianSoviet UnionSpaniardSpanishSpanish AmericanSpanish American IndianSri LankanSubsaharan AfricanSudaneseSwedishSwissSyrianTaiwaneseThaiTlingit-HaidaTohono O'OdhamTonganTrinidadian and TobagonianTsimshianTurkishU.S. Virgin IslanderUgandanUkrainianUruguayanUteVenezuelanVietnameseWelshWest IndianYakamaYaquiYugoslavianYumanYup'ikZimbabwean
Immigration
NonimmigrantsImmigrantsAfghanistanAfricaAlbaniaArgentinaArmeniaAsiaAustraliaAustriaBahamasBangladeshBarbadosBelarusBelgiumBelizeBoliviaBosnia and HerzegovinaBrazilBulgariaBurma/MyanmarCabo VerdeCambodiaCameroonCanadaCaribbeanCentral AmericaChileChinaColombiaCongoCosta RicaCroatiaCubaCzechoslovakiaDenmarkDominicaDominican RepublicEastern AfricaEastern AsiaEastern EuropeEcuadorEgyptEl SalvadorEnglandEritreaEthiopiaEuropeFijiFranceGermanyGhanaGreeceGrenadaGuatemalaGuyanaHaitiHondurasHong KongHungaryIndiaIndonesiaIranIraqIrelandIsraelItalyJamaicaJapanJordanKazakhstanKenyaKoreaKuwaitLaosLatin AmericaLatviaLebanonLiberiaLithuaniaMalaysiaMexicoMicronesiaMiddle AfricaMoldovaMoroccoNepalNetherlandsNicaraguaNigeriaNorth AmericaNorth MacedoniaNorthern AfricaNorthern EuropeNorwayOceaniaPakistanPanamaPeruPhilippinesPolandPortugalRomaniaRussiaSaudi ArabiaScotlandSenegalSerbiaSierra LeoneSingaporeSomaliaSouth AfricaSouth AmericaSouth Central AsiaSouth Eastern AsiaSouthern EuropeSpainSri LankaSt. Vincent and the GrenadinesSudanSwedenSwitzerlandSyriaTaiwanThailandTrinidad and TobagoTurkeyUgandaUkraineUruguayUzbekistanVenezuelaVietnamWest IndiesWestern AfricaWestern AsiaWestern EuropeYemenZaireZimbabweAzores
Unemployment Among Ages 30 to 34 years
Income
Poverty
Unemployment
Labor Participation
Family Structure
Vehicle Availability
Education Level
Disability

Unemployment Among Ages 30 to 34 years Comparison

Malaysians

Choctaw

Average
Tragic
5.5%
UNEMPLOYMENT AMONG AGES 30 TO 34 YEARS
41.8/ 100
METRIC RATING
184th/ 347
METRIC RANK
6.4%
UNEMPLOYMENT AMONG AGES 30 TO 34 YEARS
0.0/ 100
METRIC RATING
285th/ 347
METRIC RANK

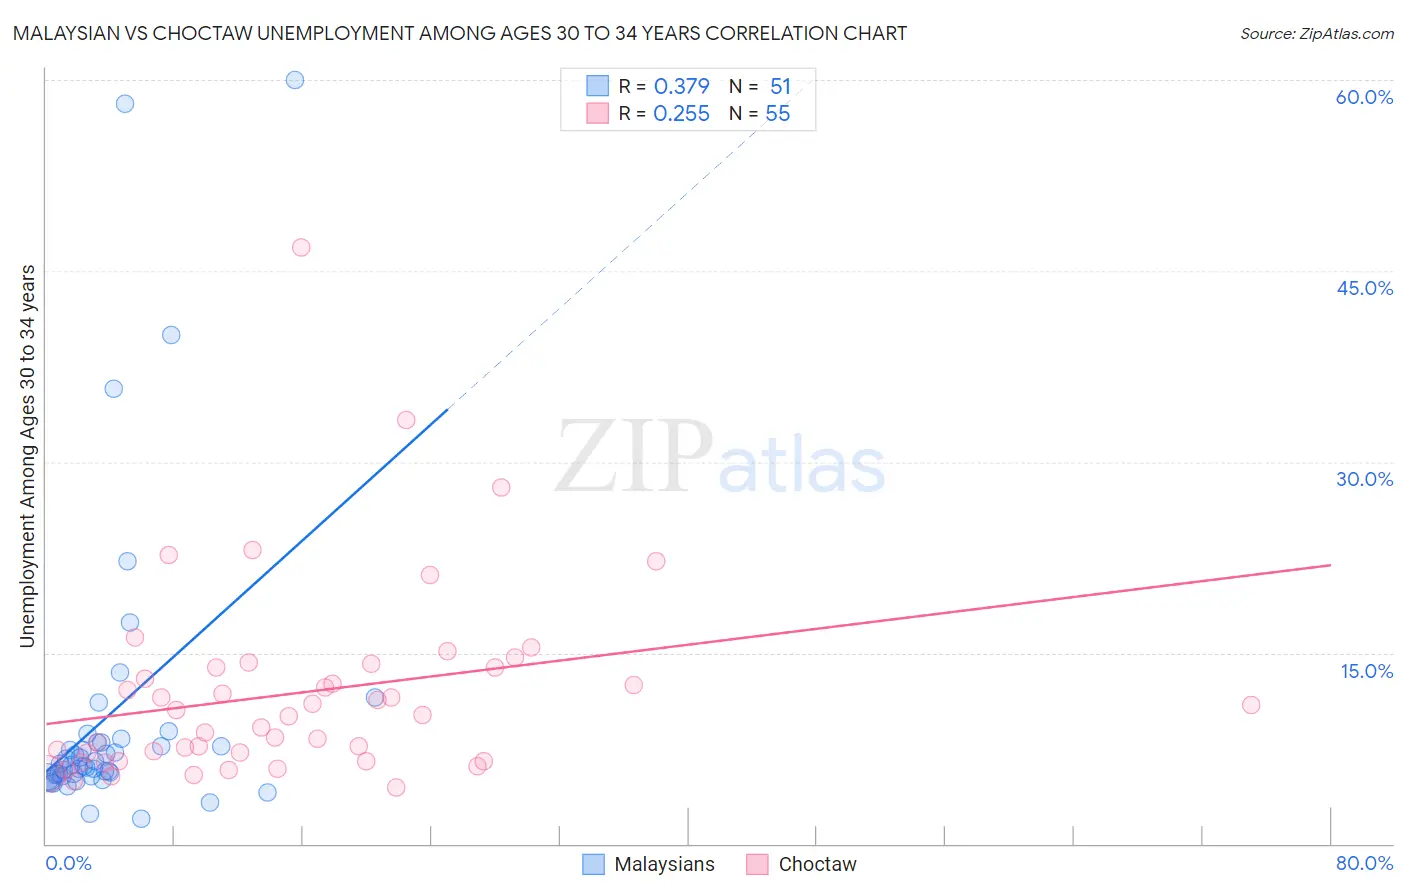
Malaysian vs Choctaw Unemployment Among Ages 30 to 34 years Correlation Chart

The statistical analysis conducted on geographies consisting of 219,995,720 people shows a mild positive correlation between the proportion of Malaysians and unemployment rate among population between the ages 30 and 34 in the United States with a correlation coefficient (R) of 0.379 and weighted average of 5.5%. Similarly, the statistical analysis conducted on geographies consisting of 257,078,627 people shows a weak positive correlation between the proportion of Choctaw and unemployment rate among population between the ages 30 and 34 in the United States with a correlation coefficient (R) of 0.255 and weighted average of 6.4%, a difference of 17.0%.
Malaysian vs Choctaw Unemployment Among Ages 30 to 34 years

Unemployment Among Ages 30 to 34 years Correlation Summary

MeasurementMalaysianChoctaw
Minimum2.0%4.4%
Maximum60.0%46.8%
Range58.0%42.4%
Mean10.2%11.8%
Median6.2%10.1%
Interquartile 25% (IQ1)5.3%6.5%
Interquartile 75% (IQ3)8.0%13.9%
Interquartile Range (IQR)2.7%7.4%
Standard Deviation (Sample)12.1%7.7%
Standard Deviation (Population)12.0%7.6%

Similar Demographics by Unemployment Among Ages 30 to 34 years

Demographics Similar to Malaysians by Unemployment Among Ages 30 to 34 years

In terms of unemployment among ages 30 to 34 years, the demographic groups most similar to Malaysians are Hungarian (5.5%, a difference of 0.090%), Immigrants from Denmark (5.5%, a difference of 0.11%), Immigrants from Lebanon (5.5%, a difference of 0.12%), Immigrants from Western Europe (5.5%, a difference of 0.19%), and Canadian (5.5%, a difference of 0.25%).
DemographicsRating | RankUnemployment Among Ages 30 to 34 years
Immigrants | Ukraine
47.7
/100
|
#177
Average
5.5%
Macedonians
47.1
/100
|
#178
Average
5.5%
Costa Ricans
46.7
/100
|
#179
Average
5.5%
Italians
45.5
/100
|
#180
Average
5.5%
Immigrants | Lebanon
43.5
/100
|
#181
Average
5.5%
Immigrants | Denmark
43.4
/100
|
#182
Average
5.5%
Hungarians
43.1
/100
|
#183
Average
5.5%
Malaysians
41.8
/100
|
#184
Average
5.5%
Immigrants | Western Europe
39.1
/100
|
#185
Fair
5.5%
Canadians
38.2
/100
|
#186
Fair
5.5%
Immigrants | Western Asia
38.2
/100
|
#187
Fair
5.5%
Immigrants | Norway
36.1
/100
|
#188
Fair
5.5%
Immigrants | England
35.7
/100
|
#189
Fair
5.5%
Immigrants | Kazakhstan
33.9
/100
|
#190
Fair
5.5%
Irish
31.3
/100
|
#191
Fair
5.5%

Demographics Similar to Choctaw by Unemployment Among Ages 30 to 34 years

In terms of unemployment among ages 30 to 34 years, the demographic groups most similar to Choctaw are Central American Indian (6.4%, a difference of 0.040%), Immigrants from West Indies (6.4%, a difference of 0.060%), Immigrants from Bangladesh (6.4%, a difference of 0.10%), Senegalese (6.4%, a difference of 0.10%), and Menominee (6.4%, a difference of 0.14%).
DemographicsRating | RankUnemployment Among Ages 30 to 34 years
Osage
0.0
/100
|
#278
Tragic
6.3%
Cree
0.0
/100
|
#279
Tragic
6.4%
Cherokee
0.0
/100
|
#280
Tragic
6.4%
Immigrants | Caribbean
0.0
/100
|
#281
Tragic
6.4%
Africans
0.0
/100
|
#282
Tragic
6.4%
Hispanics or Latinos
0.0
/100
|
#283
Tragic
6.4%
Immigrants | Bangladesh
0.0
/100
|
#284
Tragic
6.4%
Choctaw
0.0
/100
|
#285
Tragic
6.4%
Central American Indians
0.0
/100
|
#286
Tragic
6.4%
Immigrants | West Indies
0.0
/100
|
#287
Tragic
6.4%
Senegalese
0.0
/100
|
#288
Tragic
6.4%
Menominee
0.0
/100
|
#289
Tragic
6.4%
Immigrants | Trinidad and Tobago
0.0
/100
|
#290
Tragic
6.5%
Jamaicans
0.0
/100
|
#291
Tragic
6.5%
Vietnamese
0.0
/100
|
#292
Tragic
6.5%