Immigrants from North Macedonia vs Immigrants from Dominica Unemployment Among Ages 30 to 34 years
COMPARE
Immigrants from North Macedonia
Immigrants from Dominica
Unemployment Among Ages 30 to 34 years
Unemployment Among Ages 30 to 34 years Comparison
Immigrants from North Macedonia
Immigrants from Dominica
5.2%
UNEMPLOYMENT AMONG AGES 30 TO 34 YEARS
90.9/ 100
METRIC RATING
98th/ 347
METRIC RANK
7.3%
UNEMPLOYMENT AMONG AGES 30 TO 34 YEARS
0.0/ 100
METRIC RATING
324th/ 347
METRIC RANK
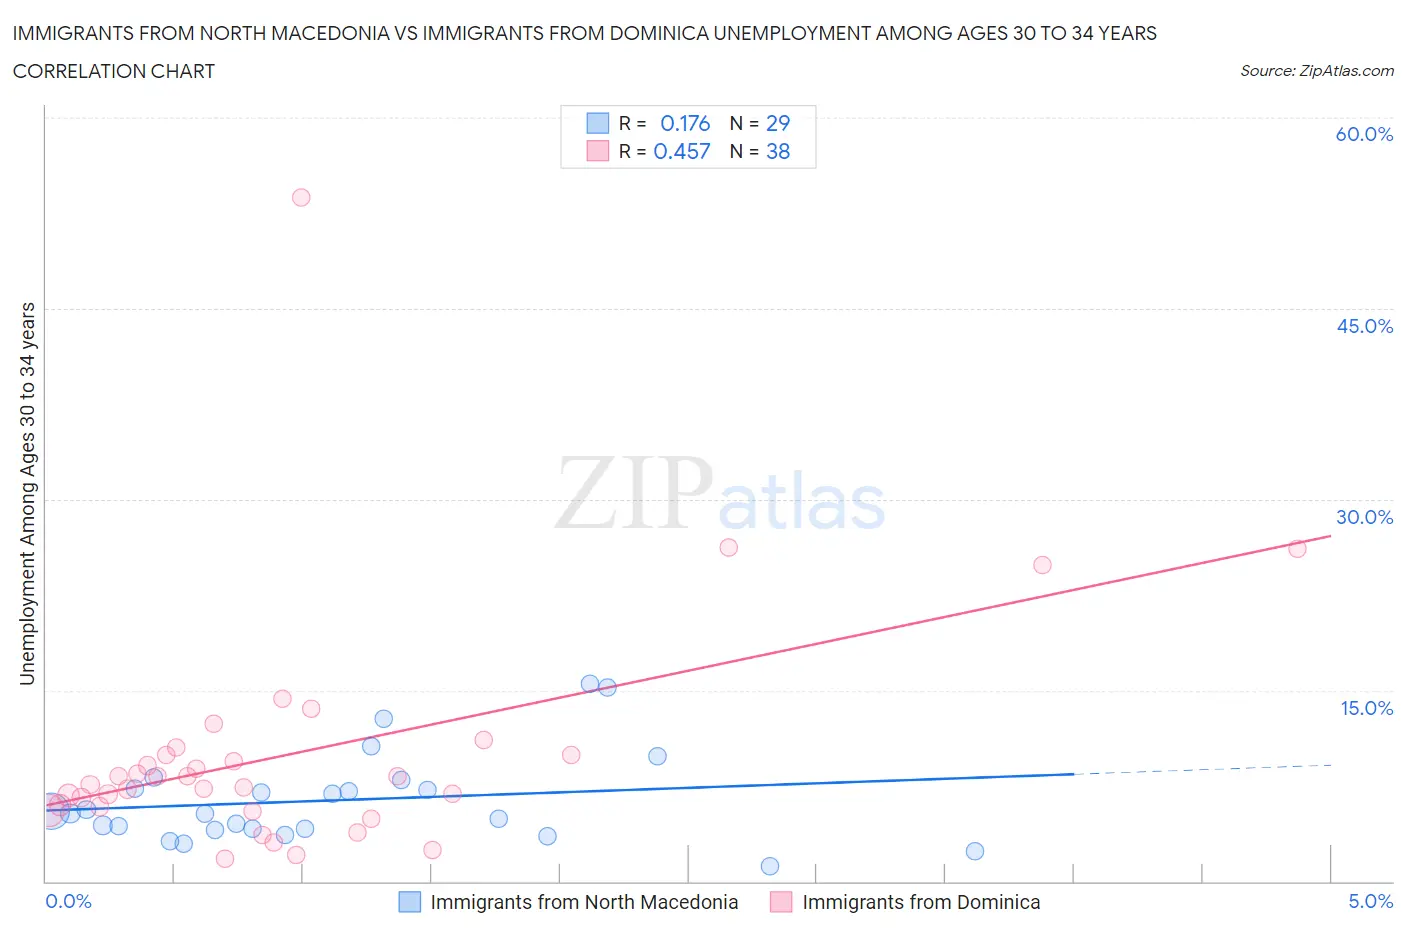
Immigrants from North Macedonia vs Immigrants from Dominica Unemployment Among Ages 30 to 34 years Correlation Chart
The statistical analysis conducted on geographies consisting of 72,707,870 people shows a poor positive correlation between the proportion of Immigrants from North Macedonia and unemployment rate among population between the ages 30 and 34 in the United States with a correlation coefficient (R) of 0.176 and weighted average of 5.2%. Similarly, the statistical analysis conducted on geographies consisting of 82,843,702 people shows a moderate positive correlation between the proportion of Immigrants from Dominica and unemployment rate among population between the ages 30 and 34 in the United States with a correlation coefficient (R) of 0.457 and weighted average of 7.3%, a difference of 39.6%.
Unemployment Among Ages 30 to 34 years Correlation Summary
| Measurement | Immigrants from North Macedonia | Immigrants from Dominica |
| Minimum | 1.2% | 1.7% |
| Maximum | 15.5% | 53.7% |
| Range | 14.3% | 52.0% |
| Mean | 6.4% | 10.1% |
| Median | 5.3% | 7.9% |
| Interquartile 25% (IQ1) | 4.1% | 5.8% |
| Interquartile 75% (IQ3) | 7.6% | 9.9% |
| Interquartile Range (IQR) | 3.5% | 4.1% |
| Standard Deviation (Sample) | 3.5% | 9.3% |
| Standard Deviation (Population) | 3.5% | 9.2% |
Similar Demographics by Unemployment Among Ages 30 to 34 years
Demographics Similar to Immigrants from North Macedonia by Unemployment Among Ages 30 to 34 years
In terms of unemployment among ages 30 to 34 years, the demographic groups most similar to Immigrants from North Macedonia are Immigrants from Ireland (5.2%, a difference of 0.070%), European (5.2%, a difference of 0.18%), Mongolian (5.2%, a difference of 0.19%), Immigrants from Czechoslovakia (5.3%, a difference of 0.27%), and Kenyan (5.2%, a difference of 0.28%).
| Demographics | Rating | Rank | Unemployment Among Ages 30 to 34 years |
| Iraqis | 92.6 /100 | #91 | Exceptional 5.2% |
| Immigrants | Argentina | 92.5 /100 | #92 | Exceptional 5.2% |
| Laotians | 92.4 /100 | #93 | Exceptional 5.2% |
| Maltese | 92.3 /100 | #94 | Exceptional 5.2% |
| Kenyans | 92.1 /100 | #95 | Exceptional 5.2% |
| Mongolians | 91.7 /100 | #96 | Exceptional 5.2% |
| Europeans | 91.7 /100 | #97 | Exceptional 5.2% |
| Immigrants | North Macedonia | 90.9 /100 | #98 | Exceptional 5.2% |
| Immigrants | Ireland | 90.6 /100 | #99 | Exceptional 5.2% |
| Immigrants | Czechoslovakia | 89.5 /100 | #100 | Excellent 5.3% |
| British | 89.1 /100 | #101 | Excellent 5.3% |
| Immigrants | Switzerland | 88.8 /100 | #102 | Excellent 5.3% |
| Immigrants | Jordan | 88.8 /100 | #103 | Excellent 5.3% |
| Northern Europeans | 87.9 /100 | #104 | Excellent 5.3% |
| Argentineans | 87.9 /100 | #105 | Excellent 5.3% |
Demographics Similar to Immigrants from Dominica by Unemployment Among Ages 30 to 34 years
In terms of unemployment among ages 30 to 34 years, the demographic groups most similar to Immigrants from Dominica are Apache (7.3%, a difference of 0.28%), Immigrants from Yemen (7.3%, a difference of 0.59%), Marshallese (7.2%, a difference of 1.1%), Immigrants from Guyana (7.2%, a difference of 1.5%), and Cape Verdean (7.2%, a difference of 1.8%).
| Demographics | Rating | Rank | Unemployment Among Ages 30 to 34 years |
| Immigrants | Cabo Verde | 0.0 /100 | #317 | Tragic 7.2% |
| Blacks/African Americans | 0.0 /100 | #318 | Tragic 7.2% |
| Guyanese | 0.0 /100 | #319 | Tragic 7.2% |
| Cape Verdeans | 0.0 /100 | #320 | Tragic 7.2% |
| Immigrants | Guyana | 0.0 /100 | #321 | Tragic 7.2% |
| Marshallese | 0.0 /100 | #322 | Tragic 7.2% |
| Immigrants | Yemen | 0.0 /100 | #323 | Tragic 7.3% |
| Immigrants | Dominica | 0.0 /100 | #324 | Tragic 7.3% |
| Apache | 0.0 /100 | #325 | Tragic 7.3% |
| Dominicans | 0.0 /100 | #326 | Tragic 7.7% |
| Immigrants | Dominican Republic | 0.0 /100 | #327 | Tragic 7.7% |
| Chippewa | 0.0 /100 | #328 | Tragic 7.8% |
| Cheyenne | 0.0 /100 | #329 | Tragic 7.8% |
| Shoshone | 0.0 /100 | #330 | Tragic 7.9% |
| Sioux | 0.0 /100 | #331 | Tragic 8.0% |