Immigrants from North Macedonia vs Choctaw 3rd Grade
COMPARE
Immigrants from North Macedonia
Choctaw
3rd Grade
3rd Grade Comparison
Immigrants from North Macedonia
Choctaw
97.8%
3RD GRADE
74.5/ 100
METRIC RATING
149th/ 347
METRIC RANK
98.1%
3RD GRADE
98.0/ 100
METRIC RATING
98th/ 347
METRIC RANK
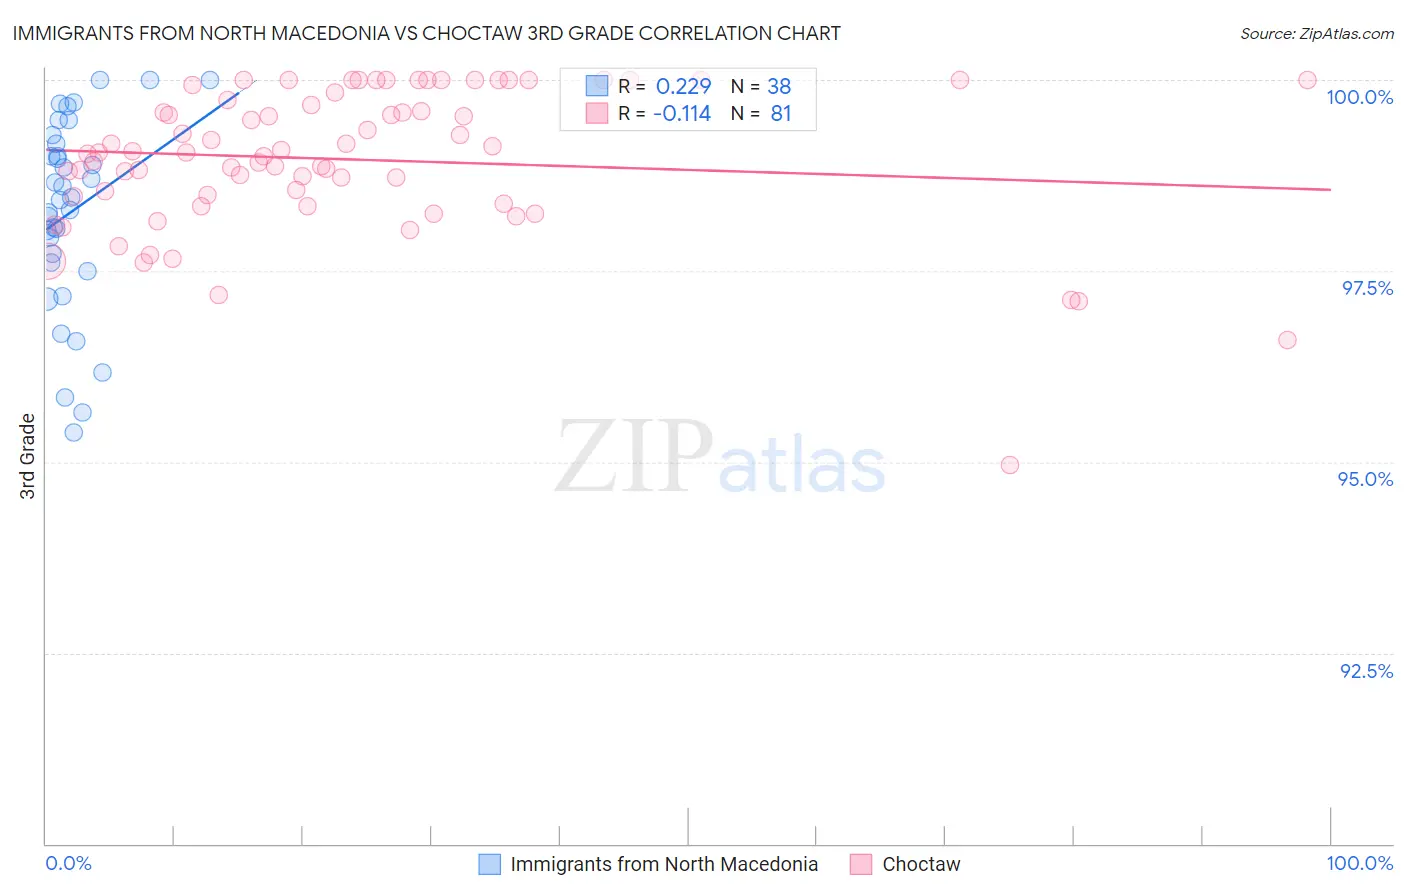
Immigrants from North Macedonia vs Choctaw 3rd Grade Correlation Chart
The statistical analysis conducted on geographies consisting of 74,317,186 people shows a weak positive correlation between the proportion of Immigrants from North Macedonia and percentage of population with at least 3rd grade education in the United States with a correlation coefficient (R) of 0.229 and weighted average of 97.8%. Similarly, the statistical analysis conducted on geographies consisting of 269,742,875 people shows a poor negative correlation between the proportion of Choctaw and percentage of population with at least 3rd grade education in the United States with a correlation coefficient (R) of -0.114 and weighted average of 98.1%, a difference of 0.24%.
3rd Grade Correlation Summary
| Measurement | Immigrants from North Macedonia | Choctaw |
| Minimum | 95.4% | 95.0% |
| Maximum | 100.0% | 100.0% |
| Range | 4.6% | 5.0% |
| Mean | 98.3% | 99.0% |
| Median | 98.4% | 99.1% |
| Interquartile 25% (IQ1) | 97.6% | 98.4% |
| Interquartile 75% (IQ3) | 99.2% | 99.8% |
| Interquartile Range (IQR) | 1.5% | 1.4% |
| Standard Deviation (Sample) | 1.2% | 0.95% |
| Standard Deviation (Population) | 1.2% | 0.94% |
Similar Demographics by 3rd Grade
Demographics Similar to Immigrants from North Macedonia by 3rd Grade
In terms of 3rd grade, the demographic groups most similar to Immigrants from North Macedonia are Jordanian (97.8%, a difference of 0.0%), Immigrants from Israel (97.9%, a difference of 0.010%), Immigrants from Moldova (97.9%, a difference of 0.010%), Soviet Union (97.8%, a difference of 0.010%), and Burmese (97.9%, a difference of 0.020%).
| Demographics | Rating | Rank | 3rd Grade |
| Hmong | 80.3 /100 | #142 | Excellent 97.9% |
| Filipinos | 79.9 /100 | #143 | Good 97.9% |
| Burmese | 79.6 /100 | #144 | Good 97.9% |
| Immigrants | Greece | 79.5 /100 | #145 | Good 97.9% |
| Alsatians | 78.3 /100 | #146 | Good 97.9% |
| Immigrants | Israel | 77.3 /100 | #147 | Good 97.9% |
| Immigrants | Moldova | 77.1 /100 | #148 | Good 97.9% |
| Immigrants | North Macedonia | 74.5 /100 | #149 | Good 97.8% |
| Jordanians | 74.5 /100 | #150 | Good 97.8% |
| Soviet Union | 72.6 /100 | #151 | Good 97.8% |
| Immigrants | South Central Asia | 69.5 /100 | #152 | Good 97.8% |
| Apache | 68.5 /100 | #153 | Good 97.8% |
| Immigrants | Eastern Europe | 64.1 /100 | #154 | Good 97.8% |
| Bermudans | 62.6 /100 | #155 | Good 97.8% |
| Immigrants | Russia | 61.7 /100 | #156 | Good 97.8% |
Demographics Similar to Choctaw by 3rd Grade
In terms of 3rd grade, the demographic groups most similar to Choctaw are Romanian (98.1%, a difference of 0.0%), Cree (98.1%, a difference of 0.0%), Immigrants from Ireland (98.1%, a difference of 0.010%), South African (98.1%, a difference of 0.010%), and Puget Sound Salish (98.1%, a difference of 0.010%).
| Demographics | Rating | Rank | 3rd Grade |
| Hopi | 98.7 /100 | #91 | Exceptional 98.1% |
| Immigrants | South Africa | 98.7 /100 | #92 | Exceptional 98.1% |
| Immigrants | Western Europe | 98.7 /100 | #93 | Exceptional 98.1% |
| Immigrants | Germany | 98.4 /100 | #94 | Exceptional 98.1% |
| Cypriots | 98.4 /100 | #95 | Exceptional 98.1% |
| Immigrants | Ireland | 98.2 /100 | #96 | Exceptional 98.1% |
| South Africans | 98.2 /100 | #97 | Exceptional 98.1% |
| Choctaw | 98.0 /100 | #98 | Exceptional 98.1% |
| Romanians | 98.0 /100 | #99 | Exceptional 98.1% |
| Cree | 97.9 /100 | #100 | Exceptional 98.1% |
| Puget Sound Salish | 97.9 /100 | #101 | Exceptional 98.1% |
| Immigrants | Nonimmigrants | 97.8 /100 | #102 | Exceptional 98.1% |
| Yugoslavians | 97.7 /100 | #103 | Exceptional 98.1% |
| Turks | 97.6 /100 | #104 | Exceptional 98.1% |
| German Russians | 97.2 /100 | #105 | Exceptional 98.1% |