Immigrants from Nepal vs Mongolian Unemployment Among Youth under 25 years
COMPARE
Immigrants from Nepal
Mongolian
Unemployment Among Youth under 25 years
Unemployment Among Youth under 25 years Comparison
Immigrants from Nepal
Mongolians
10.8%
UNEMPLOYMENT AMONG YOUTH UNDER 25 YEARS
99.9/ 100
METRIC RATING
35th/ 347
METRIC RANK
11.1%
UNEMPLOYMENT AMONG YOUTH UNDER 25 YEARS
98.9/ 100
METRIC RATING
54th/ 347
METRIC RANK
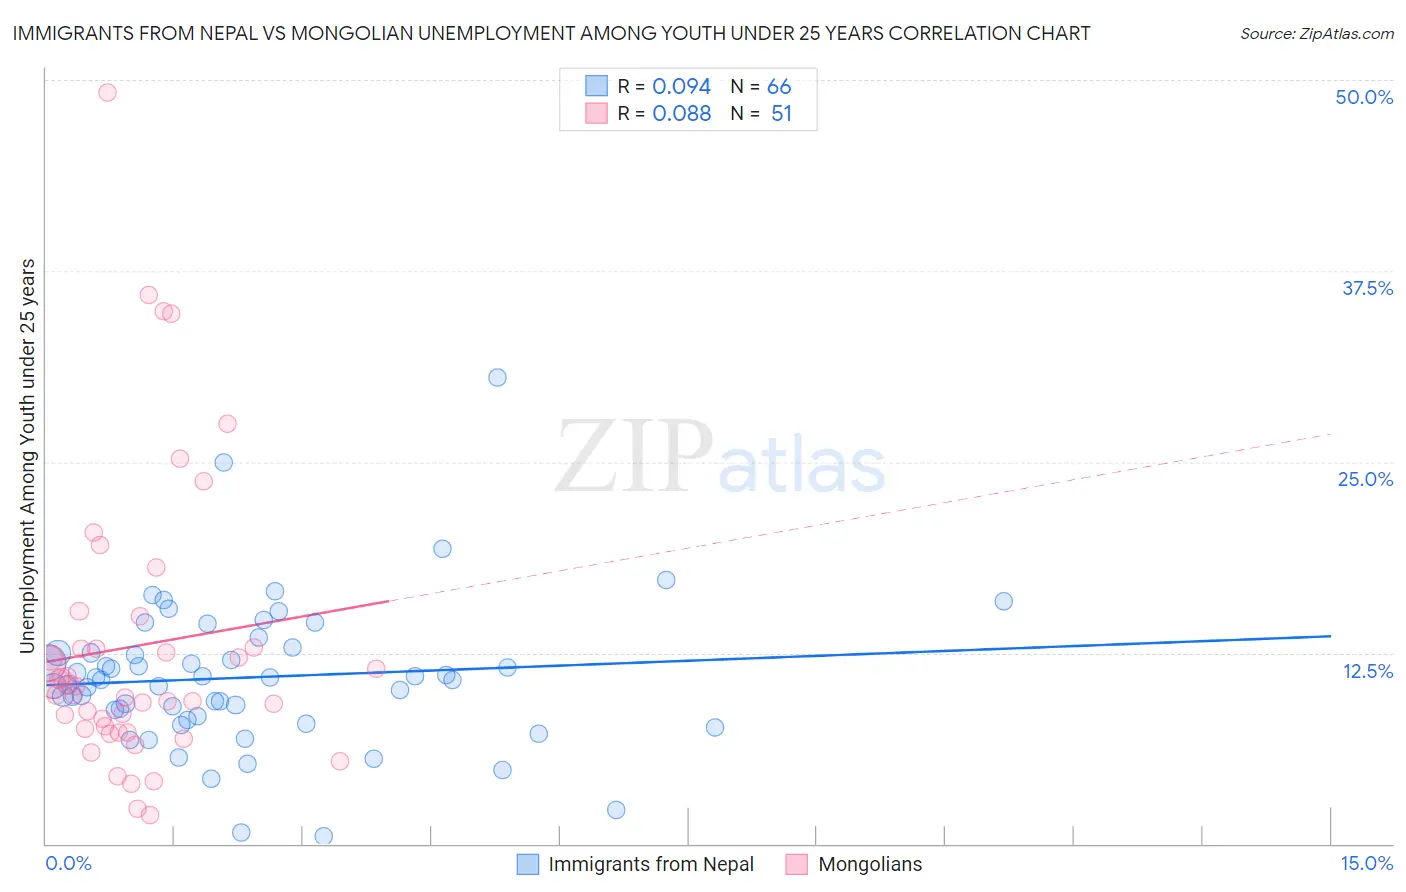
Immigrants from Nepal vs Mongolian Unemployment Among Youth under 25 years Correlation Chart
The statistical analysis conducted on geographies consisting of 186,127,349 people shows a slight positive correlation between the proportion of Immigrants from Nepal and unemployment rate among youth under the age of 25 in the United States with a correlation coefficient (R) of 0.094 and weighted average of 10.8%. Similarly, the statistical analysis conducted on geographies consisting of 140,041,883 people shows a slight positive correlation between the proportion of Mongolians and unemployment rate among youth under the age of 25 in the United States with a correlation coefficient (R) of 0.088 and weighted average of 11.1%, a difference of 2.3%.
Unemployment Among Youth under 25 years Correlation Summary
| Measurement | Immigrants from Nepal | Mongolian |
| Minimum | 0.50% | 1.9% |
| Maximum | 30.5% | 49.2% |
| Range | 30.0% | 47.3% |
| Mean | 10.9% | 12.9% |
| Median | 10.7% | 10.1% |
| Interquartile 25% (IQ1) | 8.3% | 7.5% |
| Interquartile 75% (IQ3) | 12.5% | 12.8% |
| Interquartile Range (IQR) | 4.2% | 5.3% |
| Standard Deviation (Sample) | 4.8% | 9.4% |
| Standard Deviation (Population) | 4.8% | 9.3% |
Demographics Similar to Immigrants from Nepal and Mongolians by Unemployment Among Youth under 25 years
In terms of unemployment among youth under 25 years, the demographic groups most similar to Immigrants from Nepal are English (10.8%, a difference of 0.080%), Hmong (10.8%, a difference of 0.13%), Immigrants from Zimbabwe (10.8%, a difference of 0.29%), Immigrants from Congo (10.9%, a difference of 0.36%), and Immigrants from Zaire (10.9%, a difference of 0.37%). Similarly, the demographic groups most similar to Mongolians are Ottawa (11.1%, a difference of 0.090%), Latvian (11.0%, a difference of 0.17%), Serbian (11.0%, a difference of 0.19%), Czechoslovakian (11.0%, a difference of 0.42%), and Thai (11.0%, a difference of 0.52%).
| Demographics | Rating | Rank | Unemployment Among Youth under 25 years |
| English | 99.9 /100 | #34 | Exceptional 10.8% |
| Immigrants | Nepal | 99.9 /100 | #35 | Exceptional 10.8% |
| Hmong | 99.8 /100 | #36 | Exceptional 10.8% |
| Immigrants | Zimbabwe | 99.8 /100 | #37 | Exceptional 10.8% |
| Immigrants | Congo | 99.8 /100 | #38 | Exceptional 10.9% |
| Immigrants | Zaire | 99.8 /100 | #39 | Exceptional 10.9% |
| Scottish | 99.8 /100 | #40 | Exceptional 10.9% |
| Croatians | 99.8 /100 | #41 | Exceptional 10.9% |
| Cambodians | 99.7 /100 | #42 | Exceptional 10.9% |
| British | 99.7 /100 | #43 | Exceptional 10.9% |
| Welsh | 99.7 /100 | #44 | Exceptional 10.9% |
| Bulgarians | 99.6 /100 | #45 | Exceptional 10.9% |
| Tongans | 99.6 /100 | #46 | Exceptional 10.9% |
| Australians | 99.6 /100 | #47 | Exceptional 10.9% |
| Poles | 99.3 /100 | #48 | Exceptional 11.0% |
| Thais | 99.3 /100 | #49 | Exceptional 11.0% |
| Czechoslovakians | 99.2 /100 | #50 | Exceptional 11.0% |
| Serbians | 99.0 /100 | #51 | Exceptional 11.0% |
| Latvians | 99.0 /100 | #52 | Exceptional 11.0% |
| Ottawa | 99.0 /100 | #53 | Exceptional 11.1% |
| Mongolians | 98.9 /100 | #54 | Exceptional 11.1% |