Ukrainian vs Mongolian Unemployment Among Youth under 25 years
COMPARE
Ukrainian
Mongolian
Unemployment Among Youth under 25 years
Unemployment Among Youth under 25 years Comparison
Ukrainians
Mongolians
11.5%
UNEMPLOYMENT AMONG YOUTH UNDER 25 YEARS
64.3/ 100
METRIC RATING
161st/ 347
METRIC RANK
11.1%
UNEMPLOYMENT AMONG YOUTH UNDER 25 YEARS
98.9/ 100
METRIC RATING
54th/ 347
METRIC RANK
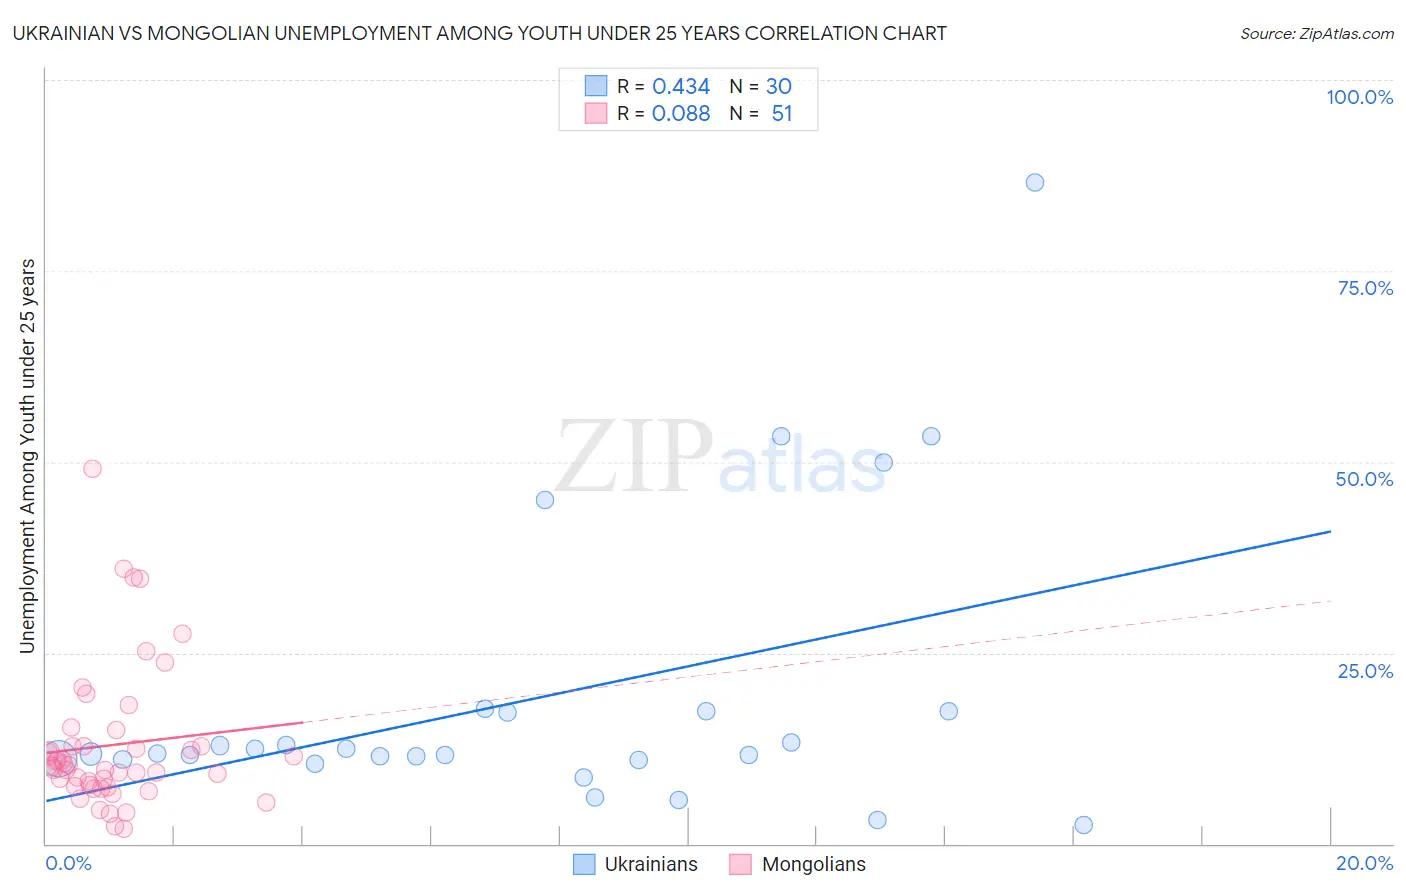
Ukrainian vs Mongolian Unemployment Among Youth under 25 years Correlation Chart
The statistical analysis conducted on geographies consisting of 439,431,900 people shows a moderate positive correlation between the proportion of Ukrainians and unemployment rate among youth under the age of 25 in the United States with a correlation coefficient (R) of 0.434 and weighted average of 11.5%. Similarly, the statistical analysis conducted on geographies consisting of 140,041,883 people shows a slight positive correlation between the proportion of Mongolians and unemployment rate among youth under the age of 25 in the United States with a correlation coefficient (R) of 0.088 and weighted average of 11.1%, a difference of 4.2%.
Unemployment Among Youth under 25 years Correlation Summary
| Measurement | Ukrainian | Mongolian |
| Minimum | 2.4% | 1.9% |
| Maximum | 86.6% | 49.2% |
| Range | 84.2% | 47.3% |
| Mean | 19.1% | 12.9% |
| Median | 11.8% | 10.1% |
| Interquartile 25% (IQ1) | 11.0% | 7.5% |
| Interquartile 75% (IQ3) | 17.3% | 12.8% |
| Interquartile Range (IQR) | 6.3% | 5.3% |
| Standard Deviation (Sample) | 18.9% | 9.4% |
| Standard Deviation (Population) | 18.6% | 9.3% |
Similar Demographics by Unemployment Among Youth under 25 years
Demographics Similar to Ukrainians by Unemployment Among Youth under 25 years
In terms of unemployment among youth under 25 years, the demographic groups most similar to Ukrainians are Immigrants from Eastern Asia (11.5%, a difference of 0.010%), Immigrants from Turkey (11.5%, a difference of 0.020%), Immigrants from Western Europe (11.5%, a difference of 0.020%), Indian (Asian) (11.5%, a difference of 0.040%), and Immigrants from Germany (11.5%, a difference of 0.070%).
| Demographics | Rating | Rank | Unemployment Among Youth under 25 years |
| Immigrants | Asia | 66.7 /100 | #154 | Good 11.5% |
| Immigrants | Romania | 66.3 /100 | #155 | Good 11.5% |
| Immigrants | Germany | 65.9 /100 | #156 | Good 11.5% |
| Indians (Asian) | 65.1 /100 | #157 | Good 11.5% |
| Immigrants | Turkey | 64.8 /100 | #158 | Good 11.5% |
| Immigrants | Western Europe | 64.7 /100 | #159 | Good 11.5% |
| Immigrants | Eastern Asia | 64.5 /100 | #160 | Good 11.5% |
| Ukrainians | 64.3 /100 | #161 | Good 11.5% |
| Immigrants | Northern Africa | 62.7 /100 | #162 | Good 11.5% |
| Immigrants | Kazakhstan | 62.7 /100 | #163 | Good 11.5% |
| Immigrants | Laos | 62.4 /100 | #164 | Good 11.5% |
| Immigrants | Sweden | 61.3 /100 | #165 | Good 11.5% |
| Spanish | 60.3 /100 | #166 | Good 11.6% |
| Okinawans | 58.7 /100 | #167 | Average 11.6% |
| Potawatomi | 57.9 /100 | #168 | Average 11.6% |
Demographics Similar to Mongolians by Unemployment Among Youth under 25 years
In terms of unemployment among youth under 25 years, the demographic groups most similar to Mongolians are Irish (11.1%, a difference of 0.0%), Immigrants from Saudi Arabia (11.1%, a difference of 0.020%), Immigrants from Eritrea (11.1%, a difference of 0.030%), Scotch-Irish (11.1%, a difference of 0.070%), and Ottawa (11.1%, a difference of 0.090%).
| Demographics | Rating | Rank | Unemployment Among Youth under 25 years |
| Australians | 99.6 /100 | #47 | Exceptional 10.9% |
| Poles | 99.3 /100 | #48 | Exceptional 11.0% |
| Thais | 99.3 /100 | #49 | Exceptional 11.0% |
| Czechoslovakians | 99.2 /100 | #50 | Exceptional 11.0% |
| Serbians | 99.0 /100 | #51 | Exceptional 11.0% |
| Latvians | 99.0 /100 | #52 | Exceptional 11.0% |
| Ottawa | 99.0 /100 | #53 | Exceptional 11.1% |
| Mongolians | 98.9 /100 | #54 | Exceptional 11.1% |
| Irish | 98.9 /100 | #55 | Exceptional 11.1% |
| Immigrants | Saudi Arabia | 98.8 /100 | #56 | Exceptional 11.1% |
| Immigrants | Eritrea | 98.8 /100 | #57 | Exceptional 11.1% |
| Scotch-Irish | 98.8 /100 | #58 | Exceptional 11.1% |
| Immigrants | Eastern Africa | 98.7 /100 | #59 | Exceptional 11.1% |
| South Africans | 98.5 /100 | #60 | Exceptional 11.1% |
| Filipinos | 98.3 /100 | #61 | Exceptional 11.1% |