Immigrants from Nepal vs Immigrants from Philippines Unemployment Among Youth under 25 years
COMPARE
Immigrants from Nepal
Immigrants from Philippines
Unemployment Among Youth under 25 years
Unemployment Among Youth under 25 years Comparison
Immigrants from Nepal
Immigrants from Philippines
10.8%
UNEMPLOYMENT AMONG YOUTH UNDER 25 YEARS
99.9/ 100
METRIC RATING
35th/ 347
METRIC RANK
11.9%
UNEMPLOYMENT AMONG YOUTH UNDER 25 YEARS
9.2/ 100
METRIC RATING
211th/ 347
METRIC RANK
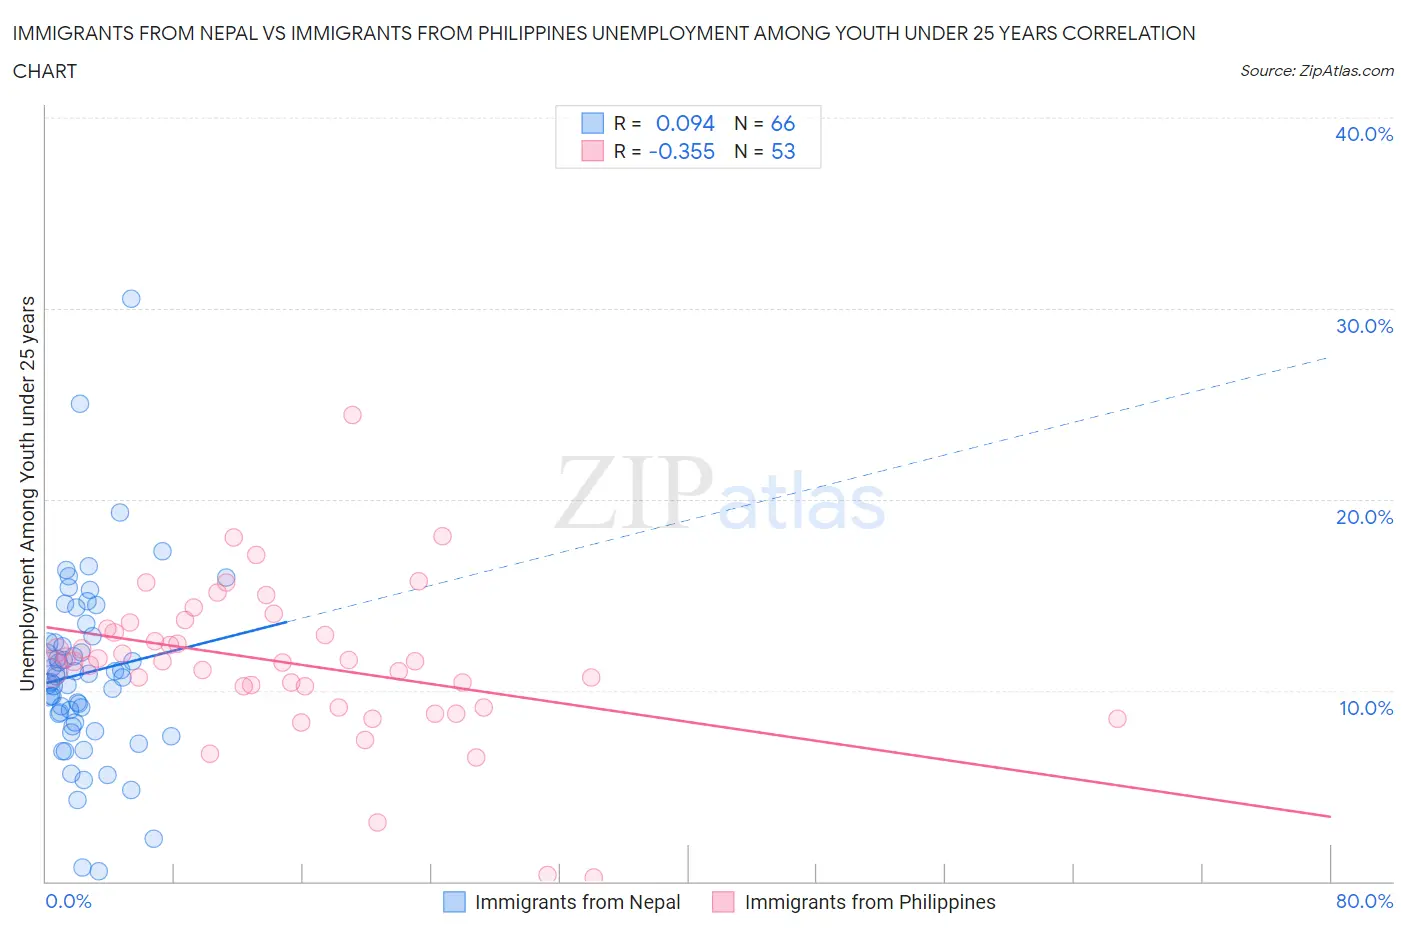
Immigrants from Nepal vs Immigrants from Philippines Unemployment Among Youth under 25 years Correlation Chart
The statistical analysis conducted on geographies consisting of 186,127,349 people shows a slight positive correlation between the proportion of Immigrants from Nepal and unemployment rate among youth under the age of 25 in the United States with a correlation coefficient (R) of 0.094 and weighted average of 10.8%. Similarly, the statistical analysis conducted on geographies consisting of 463,298,954 people shows a mild negative correlation between the proportion of Immigrants from Philippines and unemployment rate among youth under the age of 25 in the United States with a correlation coefficient (R) of -0.355 and weighted average of 11.9%, a difference of 9.8%.
Unemployment Among Youth under 25 years Correlation Summary
| Measurement | Immigrants from Nepal | Immigrants from Philippines |
| Minimum | 0.50% | 0.20% |
| Maximum | 30.5% | 24.4% |
| Range | 30.0% | 24.2% |
| Mean | 10.9% | 11.4% |
| Median | 10.7% | 11.5% |
| Interquartile 25% (IQ1) | 8.3% | 9.6% |
| Interquartile 75% (IQ3) | 12.5% | 13.4% |
| Interquartile Range (IQR) | 4.2% | 3.7% |
| Standard Deviation (Sample) | 4.8% | 4.0% |
| Standard Deviation (Population) | 4.8% | 4.0% |
Similar Demographics by Unemployment Among Youth under 25 years
Demographics Similar to Immigrants from Nepal by Unemployment Among Youth under 25 years
In terms of unemployment among youth under 25 years, the demographic groups most similar to Immigrants from Nepal are English (10.8%, a difference of 0.080%), Hmong (10.8%, a difference of 0.13%), Immigrants from Zimbabwe (10.8%, a difference of 0.29%), European (10.8%, a difference of 0.35%), and Immigrants from Congo (10.9%, a difference of 0.36%).
| Demographics | Rating | Rank | Unemployment Among Youth under 25 years |
| Somalis | 100.0 /100 | #28 | Exceptional 10.7% |
| Chinese | 99.9 /100 | #29 | Exceptional 10.7% |
| Osage | 99.9 /100 | #30 | Exceptional 10.7% |
| Slovenes | 99.9 /100 | #31 | Exceptional 10.7% |
| Taiwanese | 99.9 /100 | #32 | Exceptional 10.8% |
| Europeans | 99.9 /100 | #33 | Exceptional 10.8% |
| English | 99.9 /100 | #34 | Exceptional 10.8% |
| Immigrants | Nepal | 99.9 /100 | #35 | Exceptional 10.8% |
| Hmong | 99.8 /100 | #36 | Exceptional 10.8% |
| Immigrants | Zimbabwe | 99.8 /100 | #37 | Exceptional 10.8% |
| Immigrants | Congo | 99.8 /100 | #38 | Exceptional 10.9% |
| Immigrants | Zaire | 99.8 /100 | #39 | Exceptional 10.9% |
| Scottish | 99.8 /100 | #40 | Exceptional 10.9% |
| Croatians | 99.8 /100 | #41 | Exceptional 10.9% |
| Cambodians | 99.7 /100 | #42 | Exceptional 10.9% |
Demographics Similar to Immigrants from Philippines by Unemployment Among Youth under 25 years
In terms of unemployment among youth under 25 years, the demographic groups most similar to Immigrants from Philippines are Colombian (11.9%, a difference of 0.010%), Assyrian/Chaldean/Syriac (11.9%, a difference of 0.070%), South American (11.9%, a difference of 0.090%), Costa Rican (11.9%, a difference of 0.13%), and Immigrants from Lebanon (11.8%, a difference of 0.23%).
| Demographics | Rating | Rank | Unemployment Among Youth under 25 years |
| Immigrants | Costa Rica | 15.2 /100 | #204 | Poor 11.8% |
| Peruvians | 14.0 /100 | #205 | Poor 11.8% |
| Immigrants | Pakistan | 12.6 /100 | #206 | Poor 11.8% |
| Immigrants | Southern Europe | 12.3 /100 | #207 | Poor 11.8% |
| Comanche | 12.1 /100 | #208 | Poor 11.8% |
| Immigrants | Lebanon | 11.3 /100 | #209 | Poor 11.8% |
| Assyrians/Chaldeans/Syriacs | 9.8 /100 | #210 | Tragic 11.9% |
| Immigrants | Philippines | 9.2 /100 | #211 | Tragic 11.9% |
| Colombians | 9.1 /100 | #212 | Tragic 11.9% |
| South Americans | 8.5 /100 | #213 | Tragic 11.9% |
| Costa Ricans | 8.2 /100 | #214 | Tragic 11.9% |
| Samoans | 7.4 /100 | #215 | Tragic 11.9% |
| Guamanians/Chamorros | 7.0 /100 | #216 | Tragic 11.9% |
| Yaqui | 6.9 /100 | #217 | Tragic 11.9% |
| Immigrants | Middle Africa | 6.8 /100 | #218 | Tragic 11.9% |