Immigrants from Nepal vs Macedonian Unemployment Among Youth under 25 years
COMPARE
Immigrants from Nepal
Macedonian
Unemployment Among Youth under 25 years
Unemployment Among Youth under 25 years Comparison
Immigrants from Nepal
Macedonians
10.8%
UNEMPLOYMENT AMONG YOUTH UNDER 25 YEARS
99.9/ 100
METRIC RATING
35th/ 347
METRIC RANK
11.2%
UNEMPLOYMENT AMONG YOUTH UNDER 25 YEARS
97.7/ 100
METRIC RATING
66th/ 347
METRIC RANK
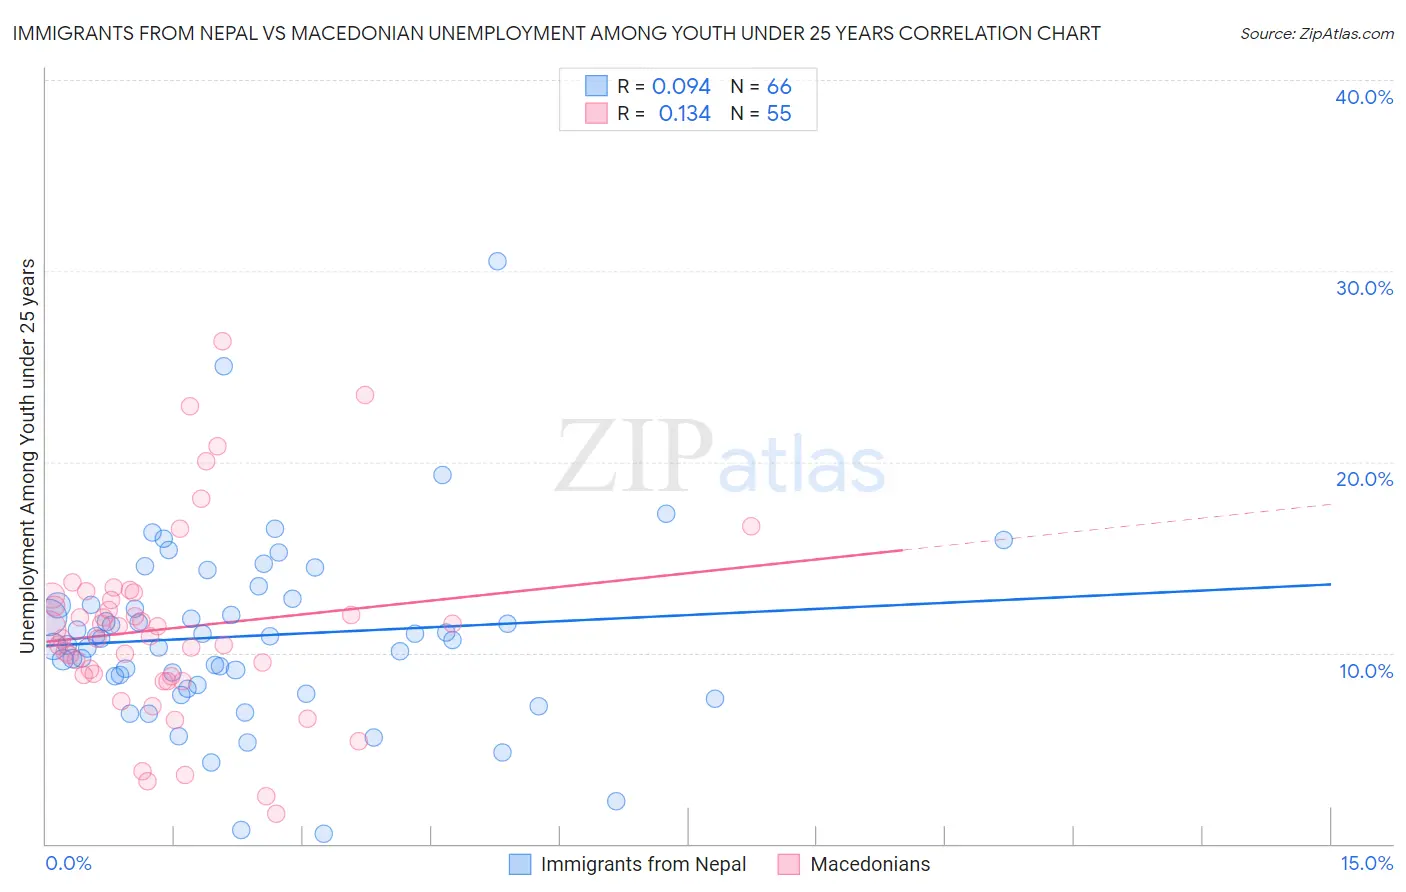
Immigrants from Nepal vs Macedonian Unemployment Among Youth under 25 years Correlation Chart
The statistical analysis conducted on geographies consisting of 186,127,349 people shows a slight positive correlation between the proportion of Immigrants from Nepal and unemployment rate among youth under the age of 25 in the United States with a correlation coefficient (R) of 0.094 and weighted average of 10.8%. Similarly, the statistical analysis conducted on geographies consisting of 132,001,261 people shows a poor positive correlation between the proportion of Macedonians and unemployment rate among youth under the age of 25 in the United States with a correlation coefficient (R) of 0.134 and weighted average of 11.2%, a difference of 3.1%.
Unemployment Among Youth under 25 years Correlation Summary
| Measurement | Immigrants from Nepal | Macedonian |
| Minimum | 0.50% | 1.6% |
| Maximum | 30.5% | 26.3% |
| Range | 30.0% | 24.7% |
| Mean | 10.9% | 11.3% |
| Median | 10.7% | 10.9% |
| Interquartile 25% (IQ1) | 8.3% | 8.8% |
| Interquartile 75% (IQ3) | 12.5% | 13.0% |
| Interquartile Range (IQR) | 4.2% | 4.2% |
| Standard Deviation (Sample) | 4.8% | 5.0% |
| Standard Deviation (Population) | 4.8% | 4.9% |
Similar Demographics by Unemployment Among Youth under 25 years
Demographics Similar to Immigrants from Nepal by Unemployment Among Youth under 25 years
In terms of unemployment among youth under 25 years, the demographic groups most similar to Immigrants from Nepal are English (10.8%, a difference of 0.080%), Hmong (10.8%, a difference of 0.13%), Immigrants from Zimbabwe (10.8%, a difference of 0.29%), European (10.8%, a difference of 0.35%), and Immigrants from Congo (10.9%, a difference of 0.36%).
| Demographics | Rating | Rank | Unemployment Among Youth under 25 years |
| Somalis | 100.0 /100 | #28 | Exceptional 10.7% |
| Chinese | 99.9 /100 | #29 | Exceptional 10.7% |
| Osage | 99.9 /100 | #30 | Exceptional 10.7% |
| Slovenes | 99.9 /100 | #31 | Exceptional 10.7% |
| Taiwanese | 99.9 /100 | #32 | Exceptional 10.8% |
| Europeans | 99.9 /100 | #33 | Exceptional 10.8% |
| English | 99.9 /100 | #34 | Exceptional 10.8% |
| Immigrants | Nepal | 99.9 /100 | #35 | Exceptional 10.8% |
| Hmong | 99.8 /100 | #36 | Exceptional 10.8% |
| Immigrants | Zimbabwe | 99.8 /100 | #37 | Exceptional 10.8% |
| Immigrants | Congo | 99.8 /100 | #38 | Exceptional 10.9% |
| Immigrants | Zaire | 99.8 /100 | #39 | Exceptional 10.9% |
| Scottish | 99.8 /100 | #40 | Exceptional 10.9% |
| Croatians | 99.8 /100 | #41 | Exceptional 10.9% |
| Cambodians | 99.7 /100 | #42 | Exceptional 10.9% |
Demographics Similar to Macedonians by Unemployment Among Youth under 25 years
In terms of unemployment among youth under 25 years, the demographic groups most similar to Macedonians are Chickasaw (11.2%, a difference of 0.020%), Immigrants from Singapore (11.2%, a difference of 0.030%), Immigrants from Kenya (11.2%, a difference of 0.040%), Immigrants from Moldova (11.2%, a difference of 0.080%), and Jordanian (11.1%, a difference of 0.090%).
| Demographics | Rating | Rank | Unemployment Among Youth under 25 years |
| Immigrants | Eastern Africa | 98.7 /100 | #59 | Exceptional 11.1% |
| South Africans | 98.5 /100 | #60 | Exceptional 11.1% |
| Filipinos | 98.3 /100 | #61 | Exceptional 11.1% |
| Immigrants | Netherlands | 98.1 /100 | #62 | Exceptional 11.1% |
| Immigrants | Croatia | 98.1 /100 | #63 | Exceptional 11.1% |
| Jordanians | 97.9 /100 | #64 | Exceptional 11.1% |
| Immigrants | Singapore | 97.8 /100 | #65 | Exceptional 11.2% |
| Macedonians | 97.7 /100 | #66 | Exceptional 11.2% |
| Chickasaw | 97.7 /100 | #67 | Exceptional 11.2% |
| Immigrants | Kenya | 97.6 /100 | #68 | Exceptional 11.2% |
| Immigrants | Moldova | 97.5 /100 | #69 | Exceptional 11.2% |
| Slavs | 97.5 /100 | #70 | Exceptional 11.2% |
| Bhutanese | 97.4 /100 | #71 | Exceptional 11.2% |
| Immigrants | Australia | 97.3 /100 | #72 | Exceptional 11.2% |
| Creek | 97.2 /100 | #73 | Exceptional 11.2% |