Immigrants from Nepal vs Canadian Unemployment Among Ages 60 to 64 years
COMPARE
Immigrants from Nepal
Canadian
Unemployment Among Ages 60 to 64 years
Unemployment Among Ages 60 to 64 years Comparison
Immigrants from Nepal
Canadians
4.5%
UNEMPLOYMENT AMONG AGES 60 TO 64 YEARS
100.0/ 100
METRIC RATING
28th/ 347
METRIC RANK
4.7%
UNEMPLOYMENT AMONG AGES 60 TO 64 YEARS
97.7/ 100
METRIC RATING
105th/ 347
METRIC RANK
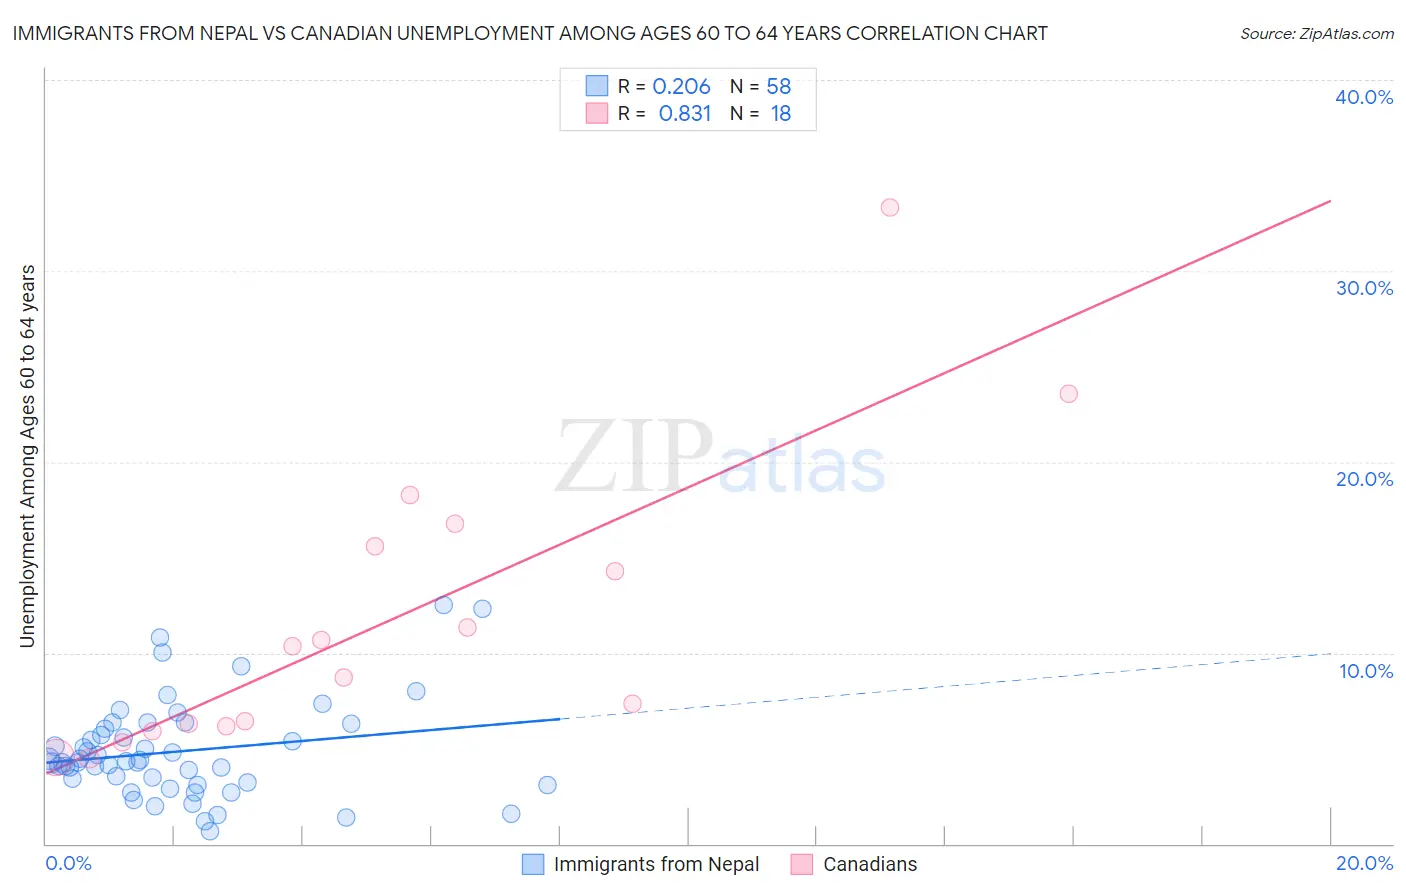
Immigrants from Nepal vs Canadian Unemployment Among Ages 60 to 64 years Correlation Chart
The statistical analysis conducted on geographies consisting of 176,465,127 people shows a weak positive correlation between the proportion of Immigrants from Nepal and unemployment rate among population between the ages 60 and 64 in the United States with a correlation coefficient (R) of 0.206 and weighted average of 4.5%. Similarly, the statistical analysis conducted on geographies consisting of 386,831,293 people shows a very strong positive correlation between the proportion of Canadians and unemployment rate among population between the ages 60 and 64 in the United States with a correlation coefficient (R) of 0.831 and weighted average of 4.7%, a difference of 5.4%.
Unemployment Among Ages 60 to 64 years Correlation Summary
| Measurement | Immigrants from Nepal | Canadian |
| Minimum | 0.63% | 4.5% |
| Maximum | 12.5% | 33.3% |
| Range | 11.9% | 28.8% |
| Mean | 4.8% | 11.6% |
| Median | 4.3% | 9.5% |
| Interquartile 25% (IQ1) | 3.2% | 6.1% |
| Interquartile 75% (IQ3) | 6.0% | 15.6% |
| Interquartile Range (IQR) | 2.8% | 9.4% |
| Standard Deviation (Sample) | 2.5% | 7.7% |
| Standard Deviation (Population) | 2.5% | 7.4% |
Similar Demographics by Unemployment Among Ages 60 to 64 years
Demographics Similar to Immigrants from Nepal by Unemployment Among Ages 60 to 64 years
In terms of unemployment among ages 60 to 64 years, the demographic groups most similar to Immigrants from Nepal are Immigrants from Iraq (4.5%, a difference of 0.070%), Czech (4.4%, a difference of 0.16%), Cuban (4.5%, a difference of 0.23%), Immigrants from Venezuela (4.5%, a difference of 0.25%), and Yugoslavian (4.4%, a difference of 0.26%).
| Demographics | Rating | Rank | Unemployment Among Ages 60 to 64 years |
| Immigrants | Cabo Verde | 100.0 /100 | #21 | Exceptional 4.4% |
| Cape Verdeans | 100.0 /100 | #22 | Exceptional 4.4% |
| Immigrants | Zaire | 100.0 /100 | #23 | Exceptional 4.4% |
| Immigrants | Burma/Myanmar | 100.0 /100 | #24 | Exceptional 4.4% |
| Yugoslavians | 100.0 /100 | #25 | Exceptional 4.4% |
| Czechs | 100.0 /100 | #26 | Exceptional 4.4% |
| Immigrants | Iraq | 100.0 /100 | #27 | Exceptional 4.5% |
| Immigrants | Nepal | 100.0 /100 | #28 | Exceptional 4.5% |
| Cubans | 100.0 /100 | #29 | Exceptional 4.5% |
| Immigrants | Venezuela | 100.0 /100 | #30 | Exceptional 4.5% |
| Immigrants | Eritrea | 100.0 /100 | #31 | Exceptional 4.5% |
| Zimbabweans | 100.0 /100 | #32 | Exceptional 4.5% |
| Carpatho Rusyns | 100.0 /100 | #33 | Exceptional 4.5% |
| Belgians | 100.0 /100 | #34 | Exceptional 4.5% |
| Germans | 100.0 /100 | #35 | Exceptional 4.5% |
Demographics Similar to Canadians by Unemployment Among Ages 60 to 64 years
In terms of unemployment among ages 60 to 64 years, the demographic groups most similar to Canadians are Paraguayan (4.7%, a difference of 0.030%), Immigrants from North America (4.7%, a difference of 0.030%), Greek (4.7%, a difference of 0.040%), White/Caucasian (4.7%, a difference of 0.070%), and Immigrants from Canada (4.7%, a difference of 0.080%).
| Demographics | Rating | Rank | Unemployment Among Ages 60 to 64 years |
| Somalis | 98.0 /100 | #98 | Exceptional 4.7% |
| Egyptians | 98.0 /100 | #99 | Exceptional 4.7% |
| Portuguese | 97.9 /100 | #100 | Exceptional 4.7% |
| Malaysians | 97.9 /100 | #101 | Exceptional 4.7% |
| Immigrants | Canada | 97.8 /100 | #102 | Exceptional 4.7% |
| Whites/Caucasians | 97.8 /100 | #103 | Exceptional 4.7% |
| Paraguayans | 97.7 /100 | #104 | Exceptional 4.7% |
| Canadians | 97.7 /100 | #105 | Exceptional 4.7% |
| Immigrants | North America | 97.6 /100 | #106 | Exceptional 4.7% |
| Greeks | 97.5 /100 | #107 | Exceptional 4.7% |
| Immigrants | Japan | 97.4 /100 | #108 | Exceptional 4.7% |
| Immigrants | Netherlands | 97.4 /100 | #109 | Exceptional 4.7% |
| Ethiopians | 97.2 /100 | #110 | Exceptional 4.7% |
| French | 97.1 /100 | #111 | Exceptional 4.7% |
| Syrians | 97.0 /100 | #112 | Exceptional 4.7% |