Immigrants from Armenia vs Immigrants from Philippines Unemployment Among Youth under 25 years
COMPARE
Immigrants from Armenia
Immigrants from Philippines
Unemployment Among Youth under 25 years
Unemployment Among Youth under 25 years Comparison
Immigrants from Armenia
Immigrants from Philippines
14.4%
UNEMPLOYMENT AMONG YOUTH UNDER 25 YEARS
0.0/ 100
METRIC RATING
313th/ 347
METRIC RANK
11.9%
UNEMPLOYMENT AMONG YOUTH UNDER 25 YEARS
9.2/ 100
METRIC RATING
211th/ 347
METRIC RANK
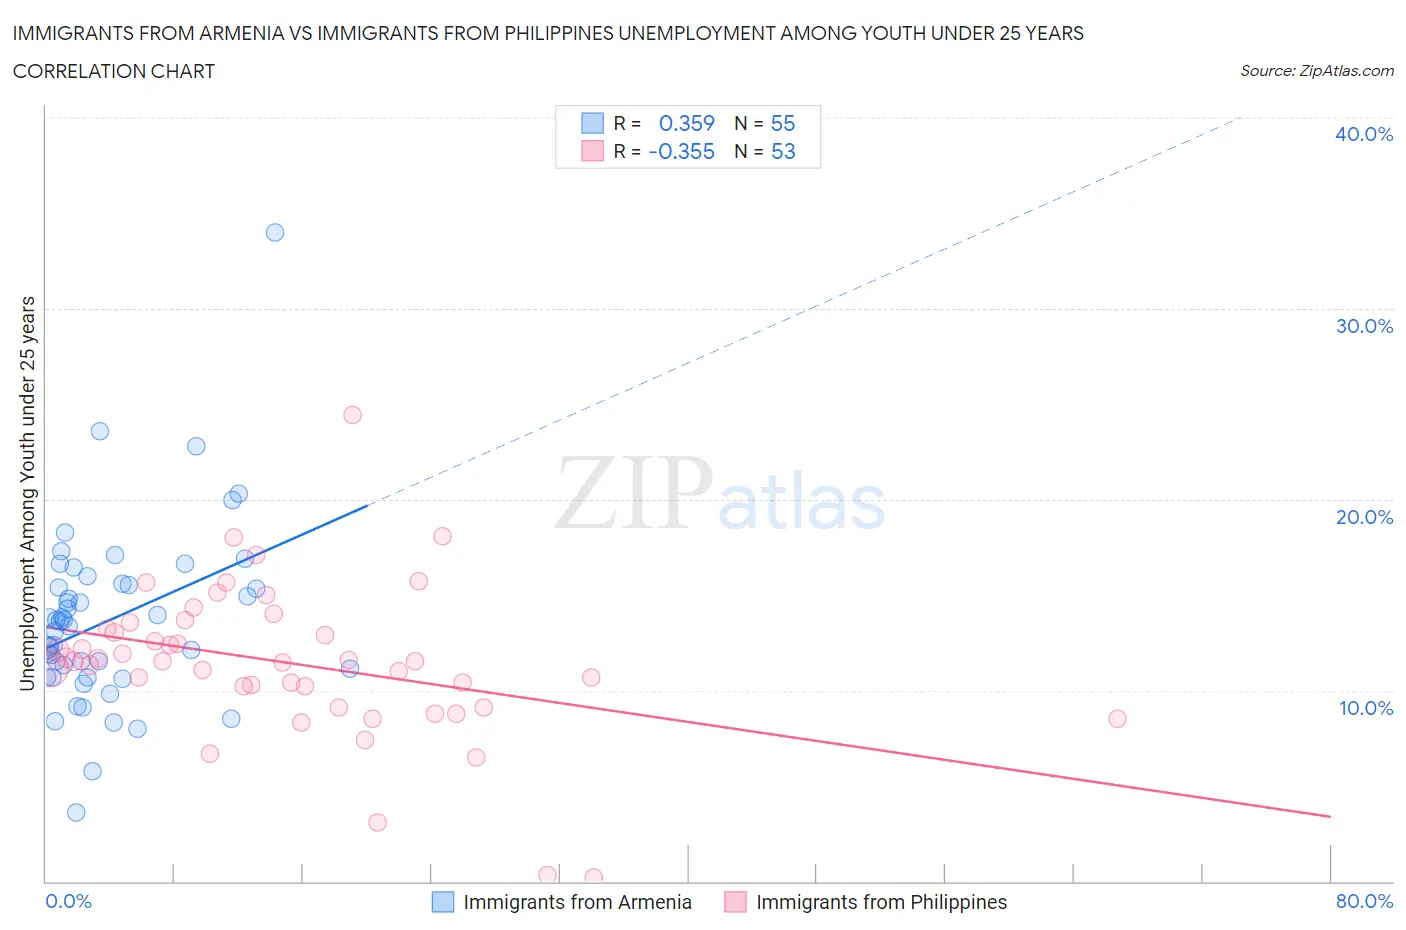
Immigrants from Armenia vs Immigrants from Philippines Unemployment Among Youth under 25 years Correlation Chart
The statistical analysis conducted on geographies consisting of 97,450,391 people shows a mild positive correlation between the proportion of Immigrants from Armenia and unemployment rate among youth under the age of 25 in the United States with a correlation coefficient (R) of 0.359 and weighted average of 14.4%. Similarly, the statistical analysis conducted on geographies consisting of 463,298,954 people shows a mild negative correlation between the proportion of Immigrants from Philippines and unemployment rate among youth under the age of 25 in the United States with a correlation coefficient (R) of -0.355 and weighted average of 11.9%, a difference of 21.0%.
Unemployment Among Youth under 25 years Correlation Summary
| Measurement | Immigrants from Armenia | Immigrants from Philippines |
| Minimum | 3.6% | 0.20% |
| Maximum | 34.0% | 24.4% |
| Range | 30.4% | 24.2% |
| Mean | 13.7% | 11.4% |
| Median | 13.6% | 11.5% |
| Interquartile 25% (IQ1) | 10.7% | 9.6% |
| Interquartile 75% (IQ3) | 15.6% | 13.4% |
| Interquartile Range (IQR) | 4.9% | 3.7% |
| Standard Deviation (Sample) | 4.7% | 4.0% |
| Standard Deviation (Population) | 4.7% | 4.0% |
Similar Demographics by Unemployment Among Youth under 25 years
Demographics Similar to Immigrants from Armenia by Unemployment Among Youth under 25 years
In terms of unemployment among youth under 25 years, the demographic groups most similar to Immigrants from Armenia are Jamaican (14.4%, a difference of 0.090%), Sioux (14.4%, a difference of 0.20%), Native/Alaskan (14.5%, a difference of 0.63%), Black/African American (14.5%, a difference of 0.71%), and Vietnamese (14.3%, a difference of 0.83%).
| Demographics | Rating | Rank | Unemployment Among Youth under 25 years |
| Pueblo | 0.0 /100 | #306 | Tragic 13.9% |
| Immigrants | Haiti | 0.0 /100 | #307 | Tragic 14.0% |
| Immigrants | Belize | 0.0 /100 | #308 | Tragic 14.0% |
| Aleuts | 0.0 /100 | #309 | Tragic 14.1% |
| Immigrants | West Indies | 0.0 /100 | #310 | Tragic 14.2% |
| Immigrants | Bangladesh | 0.0 /100 | #311 | Tragic 14.2% |
| Vietnamese | 0.0 /100 | #312 | Tragic 14.3% |
| Immigrants | Armenia | 0.0 /100 | #313 | Tragic 14.4% |
| Jamaicans | 0.0 /100 | #314 | Tragic 14.4% |
| Sioux | 0.0 /100 | #315 | Tragic 14.4% |
| Natives/Alaskans | 0.0 /100 | #316 | Tragic 14.5% |
| Blacks/African Americans | 0.0 /100 | #317 | Tragic 14.5% |
| Immigrants | Dominica | 0.0 /100 | #318 | Tragic 14.6% |
| West Indians | 0.0 /100 | #319 | Tragic 14.6% |
| Barbadians | 0.0 /100 | #320 | Tragic 14.6% |
Demographics Similar to Immigrants from Philippines by Unemployment Among Youth under 25 years
In terms of unemployment among youth under 25 years, the demographic groups most similar to Immigrants from Philippines are Colombian (11.9%, a difference of 0.010%), Assyrian/Chaldean/Syriac (11.9%, a difference of 0.070%), South American (11.9%, a difference of 0.090%), Costa Rican (11.9%, a difference of 0.13%), and Immigrants from Lebanon (11.8%, a difference of 0.23%).
| Demographics | Rating | Rank | Unemployment Among Youth under 25 years |
| Immigrants | Costa Rica | 15.2 /100 | #204 | Poor 11.8% |
| Peruvians | 14.0 /100 | #205 | Poor 11.8% |
| Immigrants | Pakistan | 12.6 /100 | #206 | Poor 11.8% |
| Immigrants | Southern Europe | 12.3 /100 | #207 | Poor 11.8% |
| Comanche | 12.1 /100 | #208 | Poor 11.8% |
| Immigrants | Lebanon | 11.3 /100 | #209 | Poor 11.8% |
| Assyrians/Chaldeans/Syriacs | 9.8 /100 | #210 | Tragic 11.9% |
| Immigrants | Philippines | 9.2 /100 | #211 | Tragic 11.9% |
| Colombians | 9.1 /100 | #212 | Tragic 11.9% |
| South Americans | 8.5 /100 | #213 | Tragic 11.9% |
| Costa Ricans | 8.2 /100 | #214 | Tragic 11.9% |
| Samoans | 7.4 /100 | #215 | Tragic 11.9% |
| Guamanians/Chamorros | 7.0 /100 | #216 | Tragic 11.9% |
| Yaqui | 6.9 /100 | #217 | Tragic 11.9% |
| Immigrants | Middle Africa | 6.8 /100 | #218 | Tragic 11.9% |