Immigrants from Senegal vs Immigrants from Philippines Unemployment Among Youth under 25 years
COMPARE
Immigrants from Senegal
Immigrants from Philippines
Unemployment Among Youth under 25 years
Unemployment Among Youth under 25 years Comparison
Immigrants from Senegal
Immigrants from Philippines
13.8%
UNEMPLOYMENT AMONG YOUTH UNDER 25 YEARS
0.0/ 100
METRIC RATING
301st/ 347
METRIC RANK
11.9%
UNEMPLOYMENT AMONG YOUTH UNDER 25 YEARS
9.2/ 100
METRIC RATING
211th/ 347
METRIC RANK
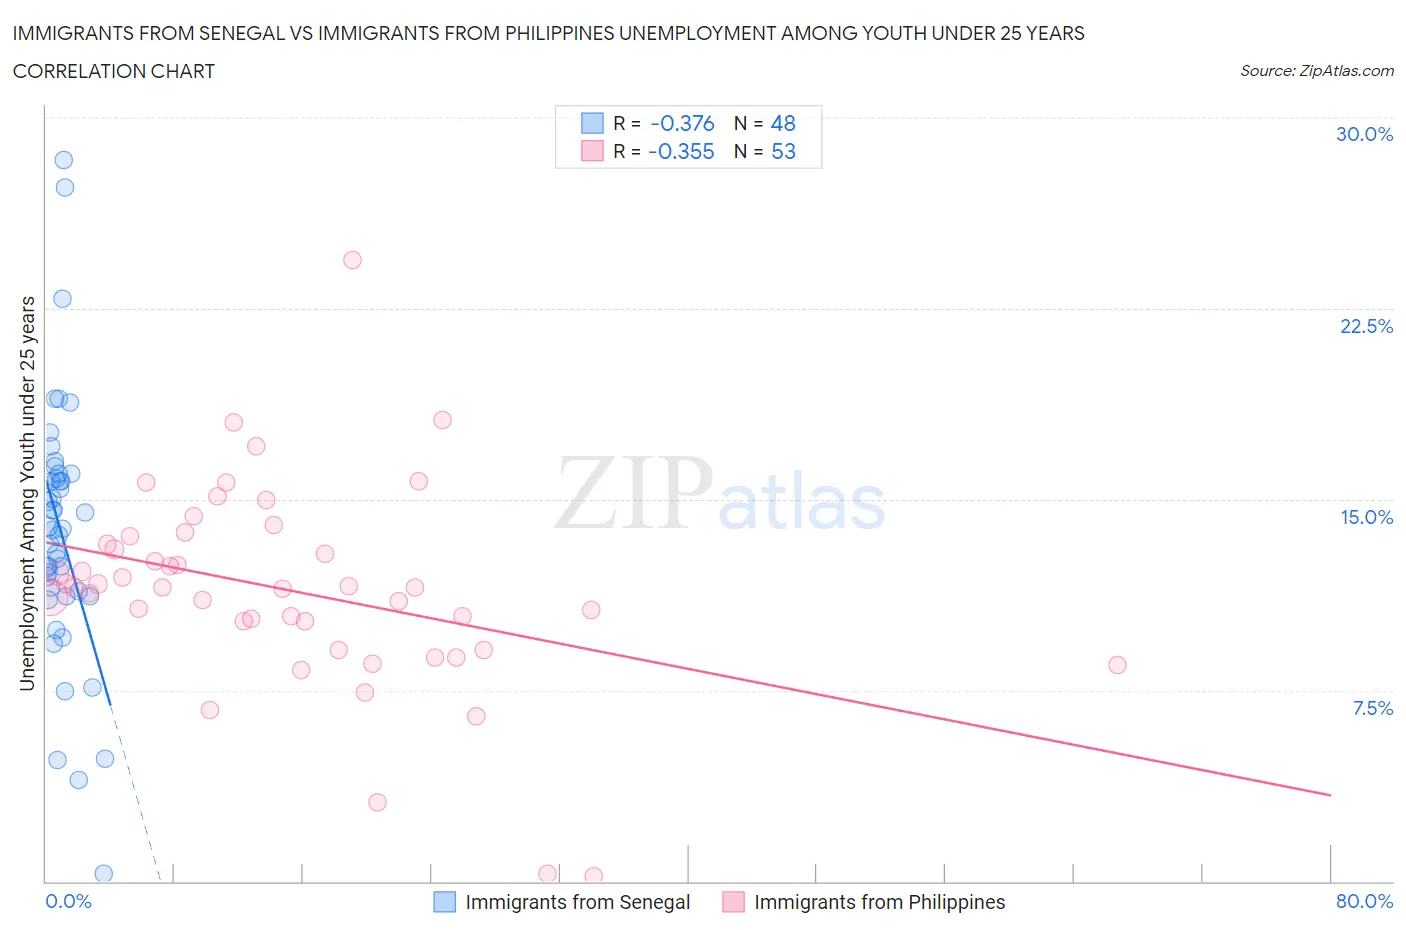
Immigrants from Senegal vs Immigrants from Philippines Unemployment Among Youth under 25 years Correlation Chart
The statistical analysis conducted on geographies consisting of 90,014,443 people shows a mild negative correlation between the proportion of Immigrants from Senegal and unemployment rate among youth under the age of 25 in the United States with a correlation coefficient (R) of -0.376 and weighted average of 13.8%. Similarly, the statistical analysis conducted on geographies consisting of 463,298,954 people shows a mild negative correlation between the proportion of Immigrants from Philippines and unemployment rate among youth under the age of 25 in the United States with a correlation coefficient (R) of -0.355 and weighted average of 11.9%, a difference of 16.4%.
Unemployment Among Youth under 25 years Correlation Summary
| Measurement | Immigrants from Senegal | Immigrants from Philippines |
| Minimum | 0.30% | 0.20% |
| Maximum | 28.3% | 24.4% |
| Range | 28.0% | 24.2% |
| Mean | 13.7% | 11.4% |
| Median | 13.8% | 11.5% |
| Interquartile 25% (IQ1) | 11.3% | 9.6% |
| Interquartile 75% (IQ3) | 15.9% | 13.4% |
| Interquartile Range (IQR) | 4.6% | 3.7% |
| Standard Deviation (Sample) | 5.1% | 4.0% |
| Standard Deviation (Population) | 5.1% | 4.0% |
Similar Demographics by Unemployment Among Youth under 25 years
Demographics Similar to Immigrants from Senegal by Unemployment Among Youth under 25 years
In terms of unemployment among youth under 25 years, the demographic groups most similar to Immigrants from Senegal are Immigrants from Sierra Leone (13.8%, a difference of 0.050%), Belizean (13.8%, a difference of 0.080%), Houma (13.8%, a difference of 0.090%), Immigrants from Cabo Verde (13.8%, a difference of 0.17%), and Tohono O'odham (13.8%, a difference of 0.38%).
| Demographics | Rating | Rank | Unemployment Among Youth under 25 years |
| Immigrants | Caribbean | 0.0 /100 | #294 | Tragic 13.5% |
| Chippewa | 0.0 /100 | #295 | Tragic 13.5% |
| Senegalese | 0.0 /100 | #296 | Tragic 13.5% |
| U.S. Virgin Islanders | 0.0 /100 | #297 | Tragic 13.6% |
| Shoshone | 0.0 /100 | #298 | Tragic 13.7% |
| Tohono O'odham | 0.0 /100 | #299 | Tragic 13.8% |
| Immigrants | Cabo Verde | 0.0 /100 | #300 | Tragic 13.8% |
| Immigrants | Senegal | 0.0 /100 | #301 | Tragic 13.8% |
| Immigrants | Sierra Leone | 0.0 /100 | #302 | Tragic 13.8% |
| Belizeans | 0.0 /100 | #303 | Tragic 13.8% |
| Houma | 0.0 /100 | #304 | Tragic 13.8% |
| Haitians | 0.0 /100 | #305 | Tragic 13.9% |
| Pueblo | 0.0 /100 | #306 | Tragic 13.9% |
| Immigrants | Haiti | 0.0 /100 | #307 | Tragic 14.0% |
| Immigrants | Belize | 0.0 /100 | #308 | Tragic 14.0% |
Demographics Similar to Immigrants from Philippines by Unemployment Among Youth under 25 years
In terms of unemployment among youth under 25 years, the demographic groups most similar to Immigrants from Philippines are Colombian (11.9%, a difference of 0.010%), Assyrian/Chaldean/Syriac (11.9%, a difference of 0.070%), South American (11.9%, a difference of 0.090%), Costa Rican (11.9%, a difference of 0.13%), and Immigrants from Lebanon (11.8%, a difference of 0.23%).
| Demographics | Rating | Rank | Unemployment Among Youth under 25 years |
| Immigrants | Costa Rica | 15.2 /100 | #204 | Poor 11.8% |
| Peruvians | 14.0 /100 | #205 | Poor 11.8% |
| Immigrants | Pakistan | 12.6 /100 | #206 | Poor 11.8% |
| Immigrants | Southern Europe | 12.3 /100 | #207 | Poor 11.8% |
| Comanche | 12.1 /100 | #208 | Poor 11.8% |
| Immigrants | Lebanon | 11.3 /100 | #209 | Poor 11.8% |
| Assyrians/Chaldeans/Syriacs | 9.8 /100 | #210 | Tragic 11.9% |
| Immigrants | Philippines | 9.2 /100 | #211 | Tragic 11.9% |
| Colombians | 9.1 /100 | #212 | Tragic 11.9% |
| South Americans | 8.5 /100 | #213 | Tragic 11.9% |
| Costa Ricans | 8.2 /100 | #214 | Tragic 11.9% |
| Samoans | 7.4 /100 | #215 | Tragic 11.9% |
| Guamanians/Chamorros | 7.0 /100 | #216 | Tragic 11.9% |
| Yaqui | 6.9 /100 | #217 | Tragic 11.9% |
| Immigrants | Middle Africa | 6.8 /100 | #218 | Tragic 11.9% |