Immigrants from Mexico vs Immigrants from Costa Rica Unemployment Among Ages 65 to 74 years
COMPARE
Immigrants from Mexico
Immigrants from Costa Rica
Unemployment Among Ages 65 to 74 years
Unemployment Among Ages 65 to 74 years Comparison
Immigrants from Mexico
Immigrants from Costa Rica
6.0%
UNEMPLOYMENT AMONG AGES 65 TO 74 YEARS
0.0/ 100
METRIC RATING
322nd/ 347
METRIC RANK
5.6%
UNEMPLOYMENT AMONG AGES 65 TO 74 YEARS
0.5/ 100
METRIC RATING
254th/ 347
METRIC RANK
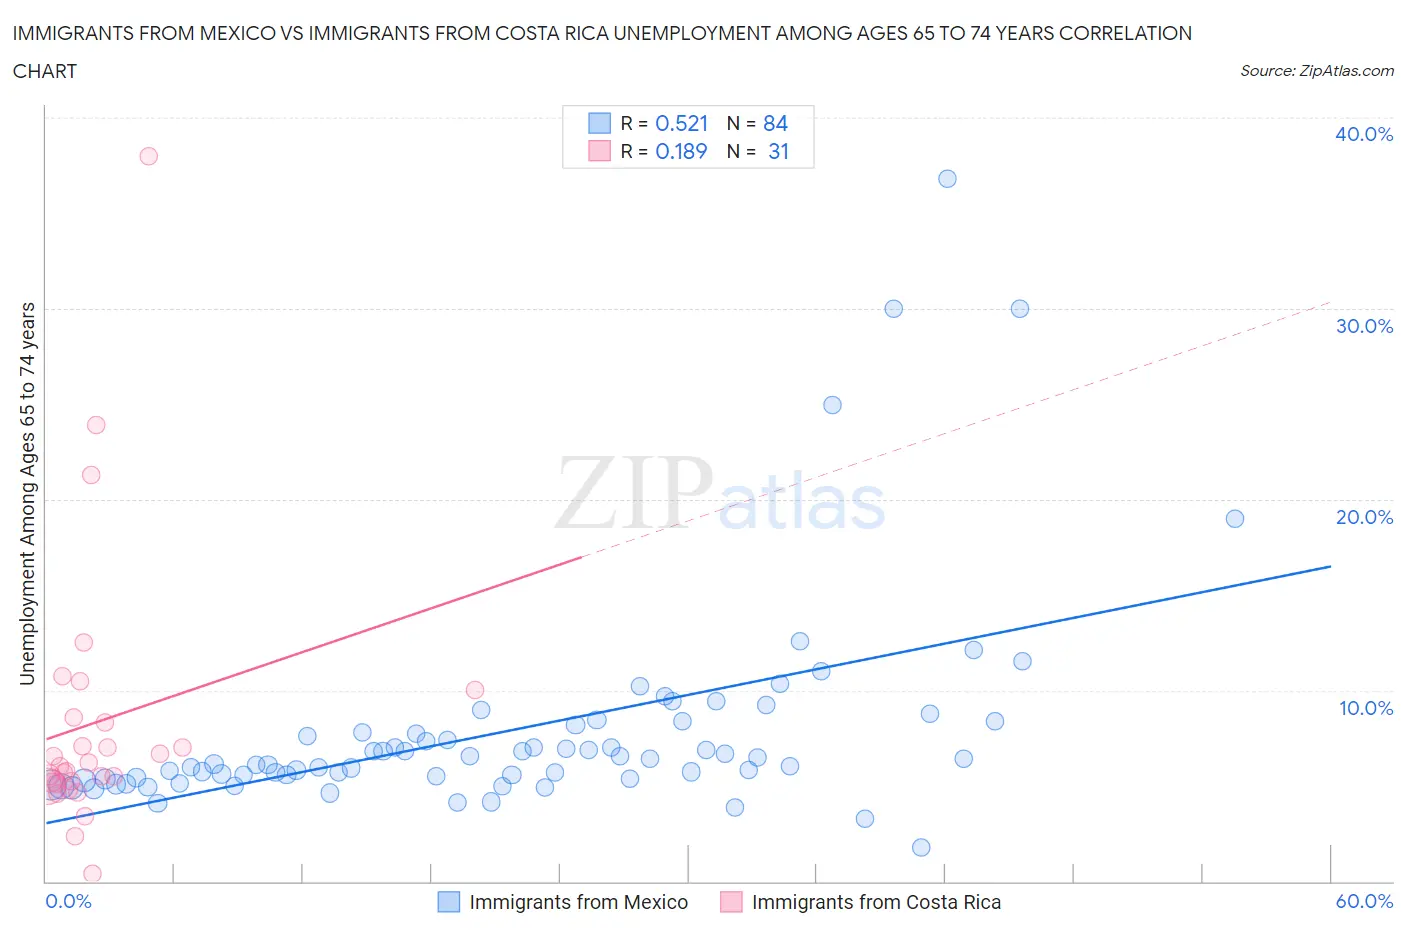
Immigrants from Mexico vs Immigrants from Costa Rica Unemployment Among Ages 65 to 74 years Correlation Chart
The statistical analysis conducted on geographies consisting of 419,156,044 people shows a substantial positive correlation between the proportion of Immigrants from Mexico and unemployment rate among population between the ages 65 and 74 in the United States with a correlation coefficient (R) of 0.521 and weighted average of 6.0%. Similarly, the statistical analysis conducted on geographies consisting of 192,577,296 people shows a poor positive correlation between the proportion of Immigrants from Costa Rica and unemployment rate among population between the ages 65 and 74 in the United States with a correlation coefficient (R) of 0.189 and weighted average of 5.6%, a difference of 6.7%.
Unemployment Among Ages 65 to 74 years Correlation Summary
| Measurement | Immigrants from Mexico | Immigrants from Costa Rica |
| Minimum | 1.8% | 0.40% |
| Maximum | 36.8% | 38.0% |
| Range | 35.0% | 37.6% |
| Mean | 7.9% | 8.4% |
| Median | 6.3% | 6.0% |
| Interquartile 25% (IQ1) | 5.4% | 5.1% |
| Interquartile 75% (IQ3) | 8.0% | 8.6% |
| Interquartile Range (IQR) | 2.6% | 3.4% |
| Standard Deviation (Sample) | 5.7% | 7.3% |
| Standard Deviation (Population) | 5.6% | 7.1% |
Similar Demographics by Unemployment Among Ages 65 to 74 years
Demographics Similar to Immigrants from Mexico by Unemployment Among Ages 65 to 74 years
In terms of unemployment among ages 65 to 74 years, the demographic groups most similar to Immigrants from Mexico are Delaware (6.0%, a difference of 0.060%), Immigrants from Dominica (6.0%, a difference of 0.22%), Immigrants from Bahamas (5.9%, a difference of 0.59%), Tohono O'odham (6.0%, a difference of 0.63%), and Aleut (5.9%, a difference of 0.68%).
| Demographics | Rating | Rank | Unemployment Among Ages 65 to 74 years |
| Immigrants | Guatemala | 0.0 /100 | #315 | Tragic 5.9% |
| Immigrants | El Salvador | 0.0 /100 | #316 | Tragic 5.9% |
| Immigrants | Central America | 0.0 /100 | #317 | Tragic 5.9% |
| Zimbabweans | 0.0 /100 | #318 | Tragic 5.9% |
| Aleuts | 0.0 /100 | #319 | Tragic 5.9% |
| Immigrants | Bahamas | 0.0 /100 | #320 | Tragic 5.9% |
| Immigrants | Dominica | 0.0 /100 | #321 | Tragic 6.0% |
| Immigrants | Mexico | 0.0 /100 | #322 | Tragic 6.0% |
| Delaware | 0.0 /100 | #323 | Tragic 6.0% |
| Tohono O'odham | 0.0 /100 | #324 | Tragic 6.0% |
| Immigrants | Portugal | 0.0 /100 | #325 | Tragic 6.0% |
| Natives/Alaskans | 0.0 /100 | #326 | Tragic 6.0% |
| Shoshone | 0.0 /100 | #327 | Tragic 6.2% |
| Immigrants | Azores | 0.0 /100 | #328 | Tragic 6.2% |
| Yuman | 0.0 /100 | #329 | Tragic 6.2% |
Demographics Similar to Immigrants from Costa Rica by Unemployment Among Ages 65 to 74 years
In terms of unemployment among ages 65 to 74 years, the demographic groups most similar to Immigrants from Costa Rica are Immigrants from Brazil (5.6%, a difference of 0.020%), Colombian (5.6%, a difference of 0.080%), Immigrants from Haiti (5.6%, a difference of 0.090%), Brazilian (5.6%, a difference of 0.12%), and Native Hawaiian (5.6%, a difference of 0.19%).
| Demographics | Rating | Rank | Unemployment Among Ages 65 to 74 years |
| Immigrants | Immigrants | 0.9 /100 | #247 | Tragic 5.6% |
| Immigrants | Argentina | 0.9 /100 | #248 | Tragic 5.6% |
| Trinidadians and Tobagonians | 0.8 /100 | #249 | Tragic 5.6% |
| Cape Verdeans | 0.7 /100 | #250 | Tragic 5.6% |
| Brazilians | 0.5 /100 | #251 | Tragic 5.6% |
| Colombians | 0.5 /100 | #252 | Tragic 5.6% |
| Immigrants | Brazil | 0.5 /100 | #253 | Tragic 5.6% |
| Immigrants | Costa Rica | 0.5 /100 | #254 | Tragic 5.6% |
| Immigrants | Haiti | 0.4 /100 | #255 | Tragic 5.6% |
| Native Hawaiians | 0.4 /100 | #256 | Tragic 5.6% |
| Immigrants | Southern Europe | 0.3 /100 | #257 | Tragic 5.6% |
| Immigrants | Western Africa | 0.3 /100 | #258 | Tragic 5.6% |
| Sierra Leoneans | 0.2 /100 | #259 | Tragic 5.6% |
| Immigrants | Barbados | 0.2 /100 | #260 | Tragic 5.6% |
| South Americans | 0.2 /100 | #261 | Tragic 5.6% |