Immigrants from Malaysia vs German Russian Unemployment Among Ages 30 to 34 years
COMPARE
Immigrants from Malaysia
German Russian
Unemployment Among Ages 30 to 34 years
Unemployment Among Ages 30 to 34 years Comparison
Immigrants from Malaysia
German Russians
5.1%
UNEMPLOYMENT AMONG AGES 30 TO 34 YEARS
98.3/ 100
METRIC RATING
49th/ 347
METRIC RANK
5.0%
UNEMPLOYMENT AMONG AGES 30 TO 34 YEARS
99.4/ 100
METRIC RATING
29th/ 347
METRIC RANK
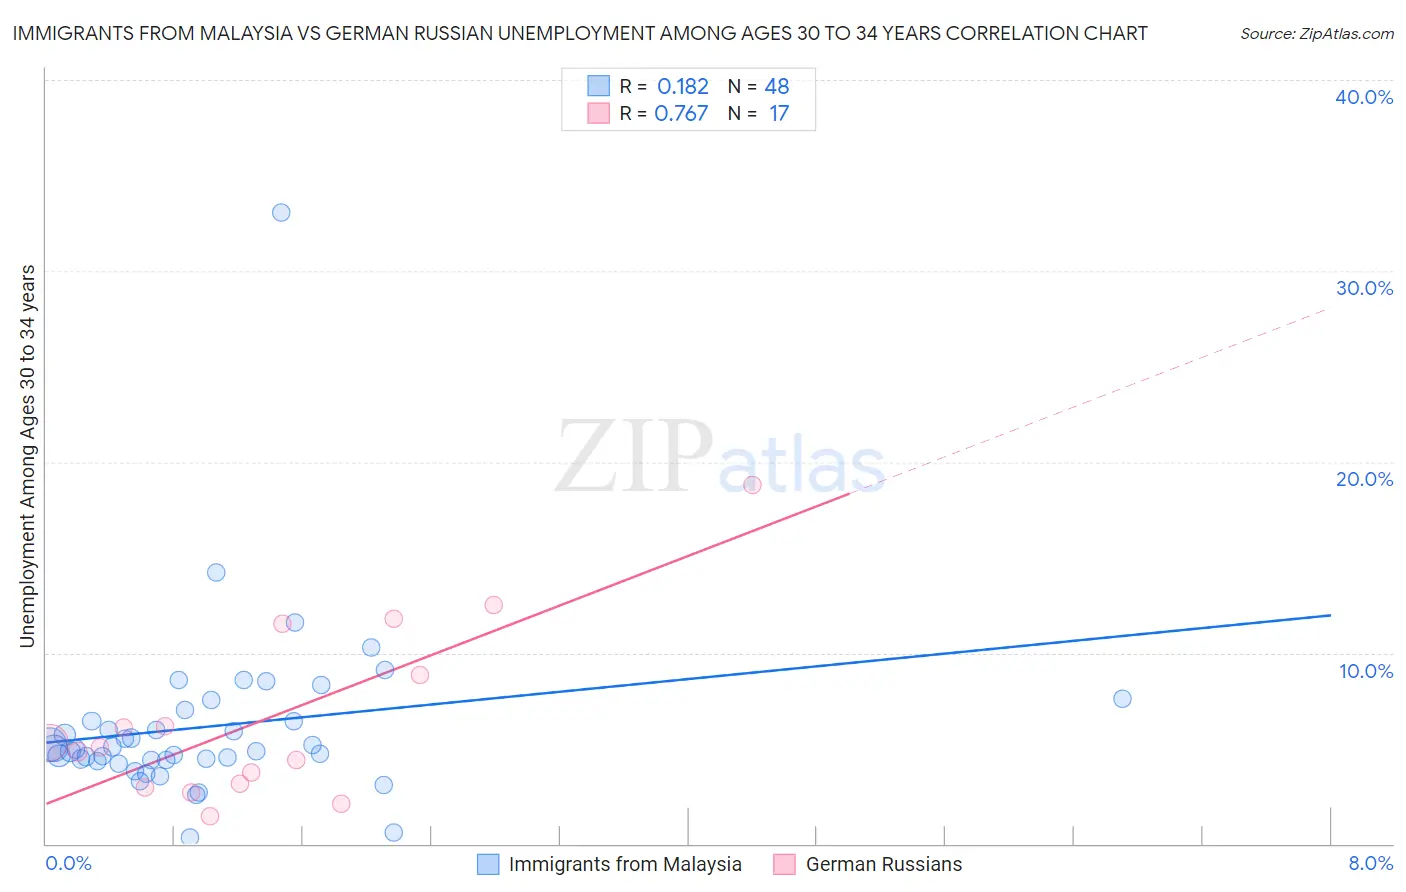
Immigrants from Malaysia vs German Russian Unemployment Among Ages 30 to 34 years Correlation Chart
The statistical analysis conducted on geographies consisting of 192,967,482 people shows a poor positive correlation between the proportion of Immigrants from Malaysia and unemployment rate among population between the ages 30 and 34 in the United States with a correlation coefficient (R) of 0.182 and weighted average of 5.1%. Similarly, the statistical analysis conducted on geographies consisting of 94,856,577 people shows a strong positive correlation between the proportion of German Russians and unemployment rate among population between the ages 30 and 34 in the United States with a correlation coefficient (R) of 0.767 and weighted average of 5.0%, a difference of 2.0%.
Unemployment Among Ages 30 to 34 years Correlation Summary
| Measurement | Immigrants from Malaysia | German Russian |
| Minimum | 0.30% | 1.5% |
| Maximum | 33.1% | 18.8% |
| Range | 32.8% | 17.3% |
| Mean | 6.1% | 6.5% |
| Median | 5.0% | 5.0% |
| Interquartile 25% (IQ1) | 4.4% | 3.0% |
| Interquartile 75% (IQ3) | 6.7% | 10.2% |
| Interquartile Range (IQR) | 2.3% | 7.1% |
| Standard Deviation (Sample) | 4.7% | 4.7% |
| Standard Deviation (Population) | 4.7% | 4.5% |
Demographics Similar to Immigrants from Malaysia and German Russians by Unemployment Among Ages 30 to 34 years
In terms of unemployment among ages 30 to 34 years, the demographic groups most similar to Immigrants from Malaysia are Assyrian/Chaldean/Syriac (5.1%, a difference of 0.12%), Cypriot (5.1%, a difference of 0.14%), Immigrants from Congo (5.1%, a difference of 0.17%), Yugoslavian (5.1%, a difference of 0.47%), and Immigrants from Belgium (5.1%, a difference of 0.50%). Similarly, the demographic groups most similar to German Russians are Norwegian (5.0%, a difference of 0.020%), Somali (5.0%, a difference of 0.11%), Immigrants from Zaire (5.0%, a difference of 0.15%), Immigrants from Saudi Arabia (5.0%, a difference of 0.25%), and Latvian (5.0%, a difference of 0.30%).
| Demographics | Rating | Rank | Unemployment Among Ages 30 to 34 years |
| German Russians | 99.4 /100 | #29 | Exceptional 5.0% |
| Norwegians | 99.4 /100 | #30 | Exceptional 5.0% |
| Somalis | 99.3 /100 | #31 | Exceptional 5.0% |
| Immigrants | Zaire | 99.3 /100 | #32 | Exceptional 5.0% |
| Immigrants | Saudi Arabia | 99.3 /100 | #33 | Exceptional 5.0% |
| Latvians | 99.3 /100 | #34 | Exceptional 5.0% |
| Immigrants | Ethiopia | 99.2 /100 | #35 | Exceptional 5.0% |
| Czechs | 99.2 /100 | #36 | Exceptional 5.0% |
| Immigrants | Turkey | 99.0 /100 | #37 | Exceptional 5.0% |
| Sri Lankans | 99.0 /100 | #38 | Exceptional 5.0% |
| Fijians | 99.0 /100 | #39 | Exceptional 5.0% |
| Immigrants | Vietnam | 98.9 /100 | #40 | Exceptional 5.0% |
| Immigrants | Eastern Africa | 98.9 /100 | #41 | Exceptional 5.0% |
| Immigrants | Hong Kong | 98.8 /100 | #42 | Exceptional 5.0% |
| Soviet Union | 98.8 /100 | #43 | Exceptional 5.0% |
| Immigrants | Belgium | 98.7 /100 | #44 | Exceptional 5.1% |
| Yugoslavians | 98.6 /100 | #45 | Exceptional 5.1% |
| Immigrants | Congo | 98.4 /100 | #46 | Exceptional 5.1% |
| Cypriots | 98.4 /100 | #47 | Exceptional 5.1% |
| Assyrians/Chaldeans/Syriacs | 98.4 /100 | #48 | Exceptional 5.1% |
| Immigrants | Malaysia | 98.3 /100 | #49 | Exceptional 5.1% |