Immigrants from Lithuania vs Slavic Female Unemployment
COMPARE
Immigrants from Lithuania
Slavic
Female Unemployment
Female Unemployment Comparison
Immigrants from Lithuania
Slavs
4.9%
FEMALE UNEMPLOYMENT
98.8/ 100
METRIC RATING
58th/ 347
METRIC RANK
4.9%
FEMALE UNEMPLOYMENT
99.1/ 100
METRIC RATING
52nd/ 347
METRIC RANK
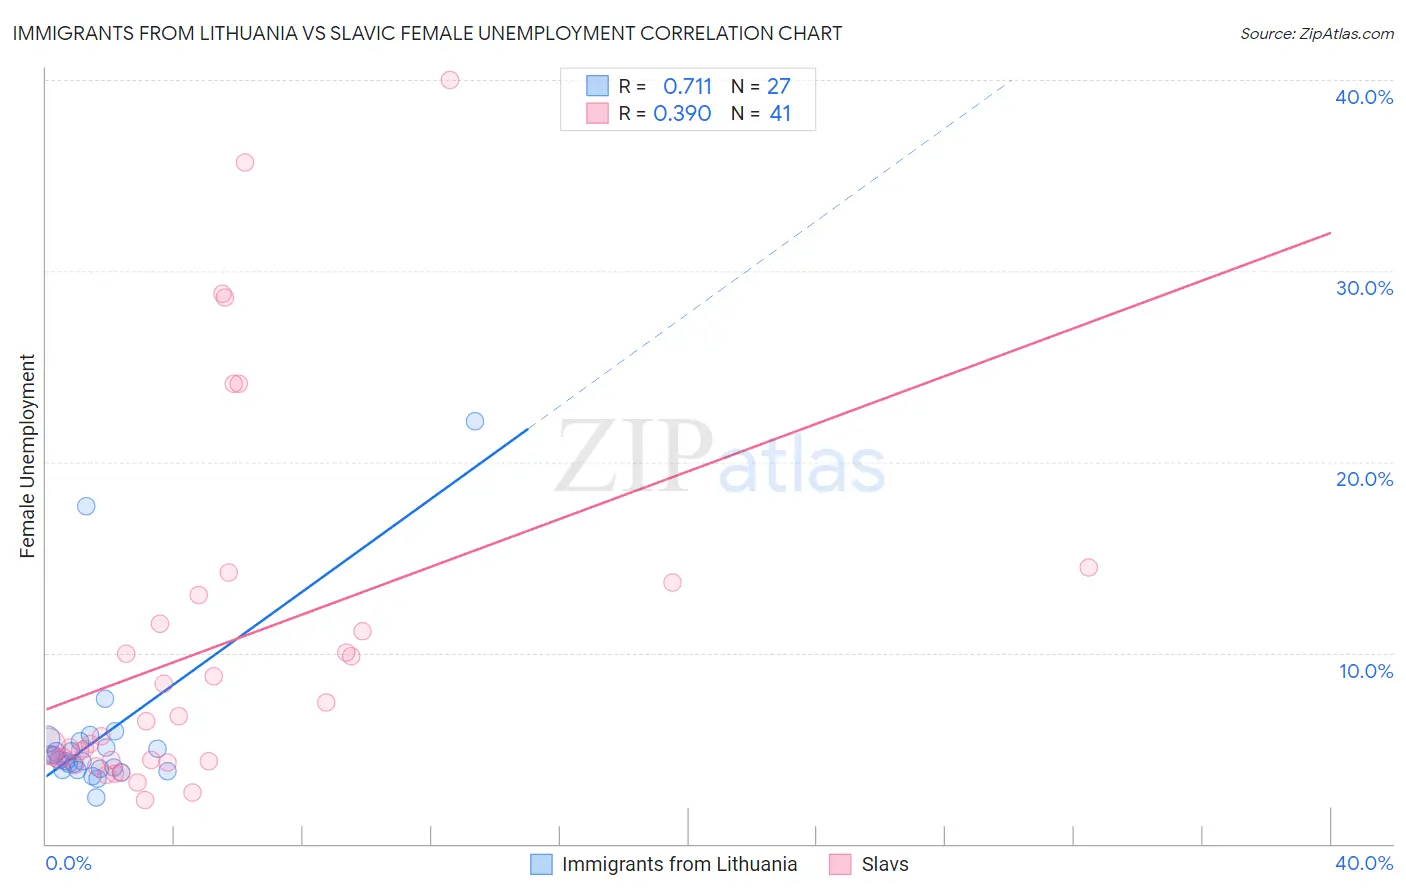
Immigrants from Lithuania vs Slavic Female Unemployment Correlation Chart
The statistical analysis conducted on geographies consisting of 117,604,968 people shows a strong positive correlation between the proportion of Immigrants from Lithuania and unemploymnet rate among females in the United States with a correlation coefficient (R) of 0.711 and weighted average of 4.9%. Similarly, the statistical analysis conducted on geographies consisting of 269,881,664 people shows a mild positive correlation between the proportion of Slavs and unemploymnet rate among females in the United States with a correlation coefficient (R) of 0.390 and weighted average of 4.9%, a difference of 0.44%.
Female Unemployment Correlation Summary
| Measurement | Immigrants from Lithuania | Slavic |
| Minimum | 2.4% | 2.3% |
| Maximum | 22.1% | 40.0% |
| Range | 19.7% | 37.7% |
| Mean | 5.7% | 10.1% |
| Median | 4.4% | 5.7% |
| Interquartile 25% (IQ1) | 3.9% | 4.3% |
| Interquartile 75% (IQ3) | 5.4% | 12.3% |
| Interquartile Range (IQR) | 1.5% | 7.9% |
| Standard Deviation (Sample) | 4.3% | 9.3% |
| Standard Deviation (Population) | 4.2% | 9.2% |
Demographics Similar to Immigrants from Lithuania and Slavs by Female Unemployment
In terms of female unemployment, the demographic groups most similar to Immigrants from Lithuania are Icelander (4.9%, a difference of 0.090%), Bhutanese (4.9%, a difference of 0.12%), Immigrants from Scotland (4.9%, a difference of 0.20%), Immigrants from Canada (4.9%, a difference of 0.20%), and Immigrants from Nepal (4.9%, a difference of 0.21%). Similarly, the demographic groups most similar to Slavs are Cambodian (4.9%, a difference of 0.020%), White/Caucasian (4.9%, a difference of 0.030%), Immigrants from Cuba (4.9%, a difference of 0.040%), Immigrants from Zimbabwe (4.9%, a difference of 0.090%), and Immigrants from Moldova (4.9%, a difference of 0.10%).
| Demographics | Rating | Rank | Female Unemployment |
| Austrians | 99.3 /100 | #45 | Exceptional 4.9% |
| Immigrants | Bulgaria | 99.3 /100 | #46 | Exceptional 4.9% |
| Okinawans | 99.3 /100 | #47 | Exceptional 4.9% |
| Thais | 99.2 /100 | #48 | Exceptional 4.9% |
| Australians | 99.2 /100 | #49 | Exceptional 4.9% |
| Immigrants | Cuba | 99.1 /100 | #50 | Exceptional 4.9% |
| Cambodians | 99.1 /100 | #51 | Exceptional 4.9% |
| Slavs | 99.1 /100 | #52 | Exceptional 4.9% |
| Whites/Caucasians | 99.0 /100 | #53 | Exceptional 4.9% |
| Immigrants | Zimbabwe | 99.0 /100 | #54 | Exceptional 4.9% |
| Immigrants | Moldova | 99.0 /100 | #55 | Exceptional 4.9% |
| Serbians | 99.0 /100 | #56 | Exceptional 4.9% |
| Icelanders | 98.8 /100 | #57 | Exceptional 4.9% |
| Immigrants | Lithuania | 98.8 /100 | #58 | Exceptional 4.9% |
| Bhutanese | 98.7 /100 | #59 | Exceptional 4.9% |
| Immigrants | Scotland | 98.6 /100 | #60 | Exceptional 4.9% |
| Immigrants | Canada | 98.6 /100 | #61 | Exceptional 4.9% |
| Immigrants | Nepal | 98.6 /100 | #62 | Exceptional 4.9% |
| Immigrants | Belgium | 98.5 /100 | #63 | Exceptional 4.9% |
| Celtics | 98.5 /100 | #64 | Exceptional 4.9% |
| Immigrants | North America | 98.3 /100 | #65 | Exceptional 4.9% |