Immigrants from Lithuania vs Immigrants from Korea Female Unemployment
COMPARE
Immigrants from Lithuania
Immigrants from Korea
Female Unemployment
Female Unemployment Comparison
Immigrants from Lithuania
Immigrants from Korea
4.9%
FEMALE UNEMPLOYMENT
98.8/ 100
METRIC RATING
58th/ 347
METRIC RANK
5.1%
FEMALE UNEMPLOYMENT
86.3/ 100
METRIC RATING
126th/ 347
METRIC RANK
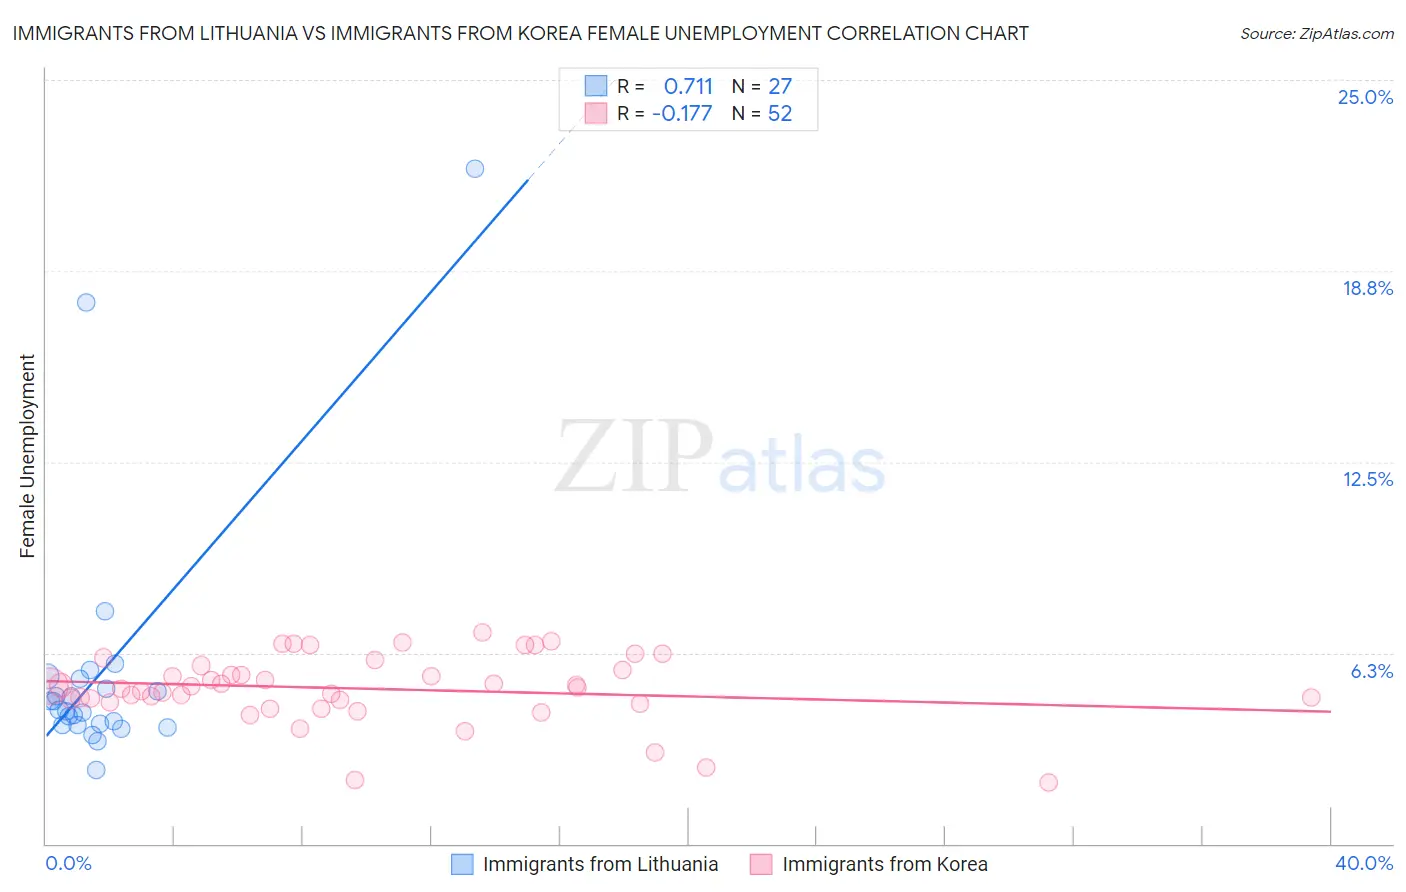
Immigrants from Lithuania vs Immigrants from Korea Female Unemployment Correlation Chart
The statistical analysis conducted on geographies consisting of 117,604,968 people shows a strong positive correlation between the proportion of Immigrants from Lithuania and unemploymnet rate among females in the United States with a correlation coefficient (R) of 0.711 and weighted average of 4.9%. Similarly, the statistical analysis conducted on geographies consisting of 414,293,995 people shows a poor negative correlation between the proportion of Immigrants from Korea and unemploymnet rate among females in the United States with a correlation coefficient (R) of -0.177 and weighted average of 5.1%, a difference of 4.1%.
Female Unemployment Correlation Summary
| Measurement | Immigrants from Lithuania | Immigrants from Korea |
| Minimum | 2.4% | 2.0% |
| Maximum | 22.1% | 6.9% |
| Range | 19.7% | 4.9% |
| Mean | 5.7% | 5.1% |
| Median | 4.4% | 5.1% |
| Interquartile 25% (IQ1) | 3.9% | 4.7% |
| Interquartile 75% (IQ3) | 5.4% | 5.8% |
| Interquartile Range (IQR) | 1.5% | 1.1% |
| Standard Deviation (Sample) | 4.3% | 1.1% |
| Standard Deviation (Population) | 4.2% | 1.1% |
Similar Demographics by Female Unemployment
Demographics Similar to Immigrants from Lithuania by Female Unemployment
In terms of female unemployment, the demographic groups most similar to Immigrants from Lithuania are Icelander (4.9%, a difference of 0.090%), Bhutanese (4.9%, a difference of 0.12%), Immigrants from Scotland (4.9%, a difference of 0.20%), Immigrants from Canada (4.9%, a difference of 0.20%), and Immigrants from Nepal (4.9%, a difference of 0.21%).
| Demographics | Rating | Rank | Female Unemployment |
| Cambodians | 99.1 /100 | #51 | Exceptional 4.9% |
| Slavs | 99.1 /100 | #52 | Exceptional 4.9% |
| Whites/Caucasians | 99.0 /100 | #53 | Exceptional 4.9% |
| Immigrants | Zimbabwe | 99.0 /100 | #54 | Exceptional 4.9% |
| Immigrants | Moldova | 99.0 /100 | #55 | Exceptional 4.9% |
| Serbians | 99.0 /100 | #56 | Exceptional 4.9% |
| Icelanders | 98.8 /100 | #57 | Exceptional 4.9% |
| Immigrants | Lithuania | 98.8 /100 | #58 | Exceptional 4.9% |
| Bhutanese | 98.7 /100 | #59 | Exceptional 4.9% |
| Immigrants | Scotland | 98.6 /100 | #60 | Exceptional 4.9% |
| Immigrants | Canada | 98.6 /100 | #61 | Exceptional 4.9% |
| Immigrants | Nepal | 98.6 /100 | #62 | Exceptional 4.9% |
| Immigrants | Belgium | 98.5 /100 | #63 | Exceptional 4.9% |
| Celtics | 98.5 /100 | #64 | Exceptional 4.9% |
| Immigrants | North America | 98.3 /100 | #65 | Exceptional 4.9% |
Demographics Similar to Immigrants from Korea by Female Unemployment
In terms of female unemployment, the demographic groups most similar to Immigrants from Korea are Basque (5.1%, a difference of 0.020%), Immigrants from Hungary (5.1%, a difference of 0.040%), Chilean (5.1%, a difference of 0.070%), Ethiopian (5.1%, a difference of 0.080%), and Maltese (5.1%, a difference of 0.10%).
| Demographics | Rating | Rank | Female Unemployment |
| Immigrants | North Macedonia | 88.3 /100 | #119 | Excellent 5.1% |
| Immigrants | Romania | 88.1 /100 | #120 | Excellent 5.1% |
| Immigrants | Western Europe | 88.1 /100 | #121 | Excellent 5.1% |
| Immigrants | Germany | 87.6 /100 | #122 | Excellent 5.1% |
| Immigrants | South Africa | 87.6 /100 | #123 | Excellent 5.1% |
| Immigrants | Europe | 87.2 /100 | #124 | Excellent 5.1% |
| Basques | 86.5 /100 | #125 | Excellent 5.1% |
| Immigrants | Korea | 86.3 /100 | #126 | Excellent 5.1% |
| Immigrants | Hungary | 86.0 /100 | #127 | Excellent 5.1% |
| Chileans | 85.8 /100 | #128 | Excellent 5.1% |
| Ethiopians | 85.7 /100 | #129 | Excellent 5.1% |
| Maltese | 85.5 /100 | #130 | Excellent 5.1% |
| Immigrants | Ethiopia | 85.4 /100 | #131 | Excellent 5.1% |
| Immigrants | Sri Lanka | 85.0 /100 | #132 | Excellent 5.1% |
| Immigrants | Hong Kong | 84.8 /100 | #133 | Excellent 5.1% |