Immigrants from Lithuania vs Marshallese Unemployment
COMPARE
Immigrants from Lithuania
Marshallese
Unemployment
Unemployment Comparison
Immigrants from Lithuania
Marshallese
5.0%
UNEMPLOYMENT
93.2/ 100
METRIC RATING
110th/ 347
METRIC RANK
5.6%
UNEMPLOYMENT
1.3/ 100
METRIC RATING
243rd/ 347
METRIC RANK
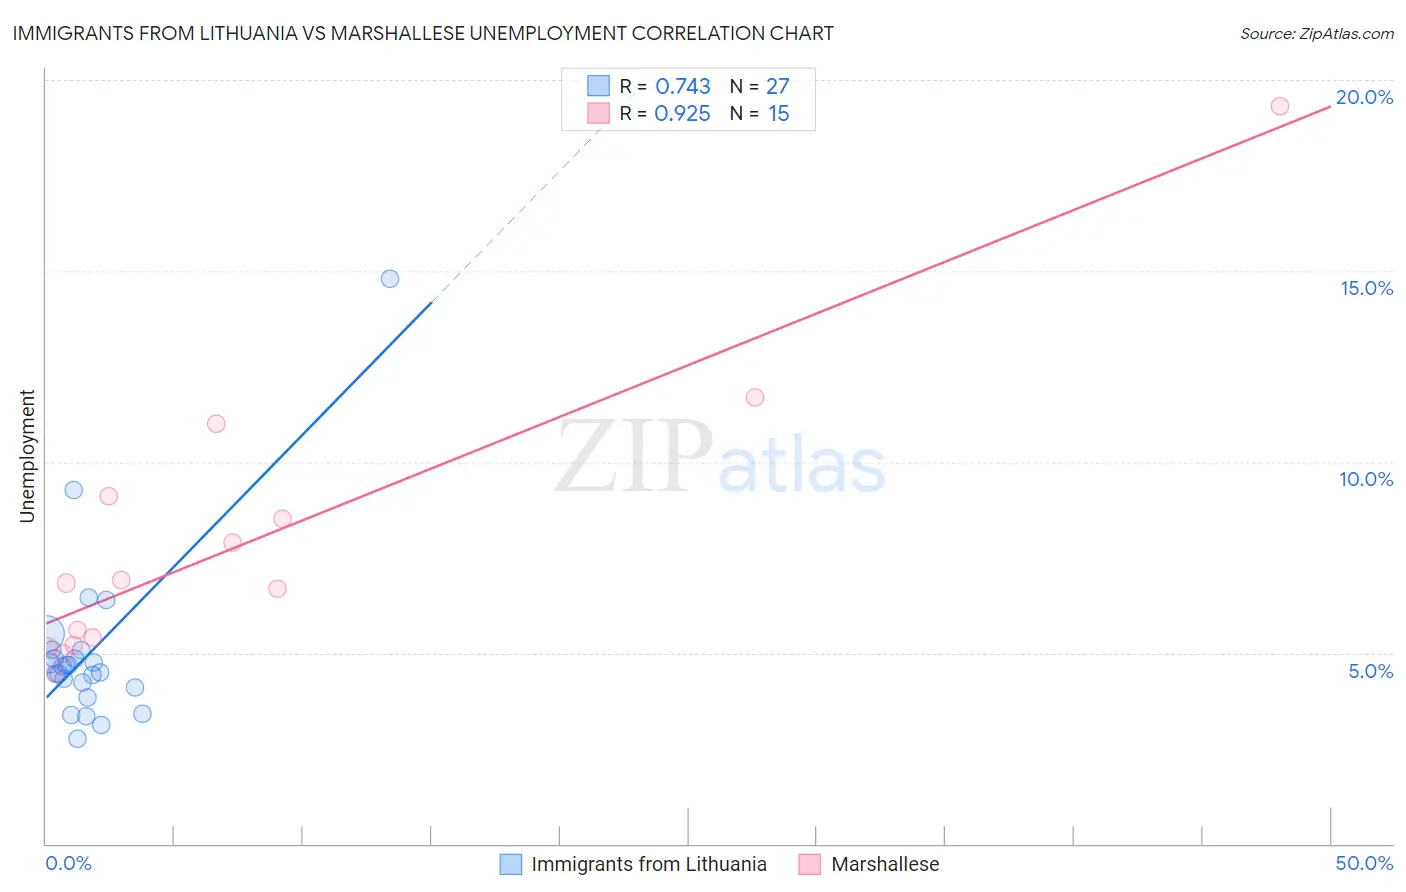
Immigrants from Lithuania vs Marshallese Unemployment Correlation Chart
The statistical analysis conducted on geographies consisting of 117,711,175 people shows a strong positive correlation between the proportion of Immigrants from Lithuania and unemployment in the United States with a correlation coefficient (R) of 0.743 and weighted average of 5.0%. Similarly, the statistical analysis conducted on geographies consisting of 14,759,035 people shows a near-perfect positive correlation between the proportion of Marshallese and unemployment in the United States with a correlation coefficient (R) of 0.925 and weighted average of 5.6%, a difference of 11.1%.
Unemployment Correlation Summary
| Measurement | Immigrants from Lithuania | Marshallese |
| Minimum | 2.7% | 4.5% |
| Maximum | 14.8% | 19.3% |
| Range | 12.1% | 14.8% |
| Mean | 5.0% | 7.9% |
| Median | 4.7% | 6.8% |
| Interquartile 25% (IQ1) | 4.1% | 5.2% |
| Interquartile 75% (IQ3) | 5.1% | 9.1% |
| Interquartile Range (IQR) | 0.96% | 3.9% |
| Standard Deviation (Sample) | 2.3% | 3.8% |
| Standard Deviation (Population) | 2.3% | 3.7% |
Similar Demographics by Unemployment
Demographics Similar to Immigrants from Lithuania by Unemployment
In terms of unemployment, the demographic groups most similar to Immigrants from Lithuania are Chilean (5.0%, a difference of 0.0%), Immigrants from Eritrea (5.0%, a difference of 0.020%), Immigrants from Kuwait (5.0%, a difference of 0.12%), Immigrants from Turkey (5.0%, a difference of 0.13%), and Immigrants from Romania (5.0%, a difference of 0.14%).
| Demographics | Rating | Rank | Unemployment |
| Chickasaw | 94.0 /100 | #103 | Exceptional 5.0% |
| Osage | 94.0 /100 | #104 | Exceptional 5.0% |
| Maltese | 94.0 /100 | #105 | Exceptional 5.0% |
| Immigrants | Romania | 93.7 /100 | #106 | Exceptional 5.0% |
| Immigrants | Turkey | 93.7 /100 | #107 | Exceptional 5.0% |
| Immigrants | Kuwait | 93.7 /100 | #108 | Exceptional 5.0% |
| Immigrants | Eritrea | 93.3 /100 | #109 | Exceptional 5.0% |
| Immigrants | Lithuania | 93.2 /100 | #110 | Exceptional 5.0% |
| Chileans | 93.2 /100 | #111 | Exceptional 5.0% |
| South Africans | 92.6 /100 | #112 | Exceptional 5.1% |
| Argentineans | 92.4 /100 | #113 | Exceptional 5.1% |
| Immigrants | Ireland | 92.1 /100 | #114 | Exceptional 5.1% |
| Immigrants | Western Europe | 91.1 /100 | #115 | Exceptional 5.1% |
| Immigrants | Sri Lanka | 91.1 /100 | #116 | Exceptional 5.1% |
| Immigrants | Malaysia | 91.0 /100 | #117 | Exceptional 5.1% |
Demographics Similar to Marshallese by Unemployment
In terms of unemployment, the demographic groups most similar to Marshallese are Dutch West Indian (5.6%, a difference of 0.15%), French American Indian (5.6%, a difference of 0.17%), Bermudan (5.6%, a difference of 0.22%), Immigrants from Cameroon (5.6%, a difference of 0.36%), and Liberian (5.6%, a difference of 0.49%).
| Demographics | Rating | Rank | Unemployment |
| Immigrants | Cambodia | 3.3 /100 | #236 | Tragic 5.5% |
| Moroccans | 3.2 /100 | #237 | Tragic 5.5% |
| Immigrants | Western Asia | 2.8 /100 | #238 | Tragic 5.5% |
| Immigrants | Immigrants | 2.6 /100 | #239 | Tragic 5.5% |
| Cree | 2.6 /100 | #240 | Tragic 5.6% |
| Tlingit-Haida | 2.0 /100 | #241 | Tragic 5.6% |
| Spanish Americans | 2.0 /100 | #242 | Tragic 5.6% |
| Marshallese | 1.3 /100 | #243 | Tragic 5.6% |
| Dutch West Indians | 1.2 /100 | #244 | Tragic 5.6% |
| French American Indians | 1.2 /100 | #245 | Tragic 5.6% |
| Bermudans | 1.1 /100 | #246 | Tragic 5.6% |
| Immigrants | Cameroon | 1.0 /100 | #247 | Tragic 5.6% |
| Liberians | 0.9 /100 | #248 | Tragic 5.6% |
| Cajuns | 0.8 /100 | #249 | Tragic 5.6% |
| Japanese | 0.8 /100 | #250 | Tragic 5.6% |