Immigrants from Lithuania vs Immigrants from North Macedonia Unemployment

COMPARE

Immigrants from Lithuania
Race
Ancestry
AfghanAfricanAlaska NativeAlaskan AthabascanAlbanianAleutAlsatianAmericanApacheArabArapahoArgentineanArmenianAssyrian/Chaldean/SyriacAustralianAustrianBahamianBangladeshiBarbadianBasqueBelgianBelizeanBermudanBhutaneseBlackfeetBolivianBrazilianBritishBritish West IndianBulgarianBurmeseCajunCambodianCanadianCape VerdeanCarpatho RusynCelticCentral AmericanCentral American IndianCherokeeCheyenneChickasawChileanChineseChippewaChoctawColombianColvilleComancheCosta RicanCreeCreekCroatianCrowCubanCypriotCzechCzechoslovakianDanishDelawareDominicanDutchDutch West IndianEastern EuropeanEcuadorianEgyptianEnglishEstonianEthiopianEuropeanFijianFilipinoFinnishFrenchFrench American IndianFrench CanadianGermanGerman RussianGhanaianGreekGuamanian/ChamorroGuatemalanGuyaneseHaitianHmongHonduranHopiHoumaHungarianIcelanderIndian (Asian)IndonesianInupiatIranianIraqiIrishIroquoisIsraeliItalianJamaicanJapaneseJordanianKenyanKiowaKoreanLaotianLatvianLebaneseLiberianLithuanianLumbeeLuxembourgerMacedonianMalaysianMalteseMarshalleseMenomineeMexicanMexican American IndianMongolianMoroccanNative HawaiianNavajoNepaleseNew ZealanderNicaraguanNigerianNorthern EuropeanNorwegianOkinawanOsageOttawaPaiutePakistaniPalestinianPanamanianParaguayanPennsylvania GermanPeruvianPimaPolishPortuguesePotawatomiPuebloPuerto RicanPuget Sound SalishRomanianRussianSalvadoranSamoanScandinavianScotch-IrishScottishSeminoleSenegaleseSerbianShoshoneSierra LeoneanSiouxSlavicSlovakSloveneSomaliSouth AfricanSouth AmericanSouth American IndianSoviet UnionSpaniardSpanishSpanish AmericanSpanish American IndianSri LankanSubsaharan AfricanSudaneseSwedishSwissSyrianTaiwaneseThaiTlingit-HaidaTohono O'OdhamTonganTrinidadian and TobagonianTsimshianTurkishU.S. Virgin IslanderUgandanUkrainianUruguayanUteVenezuelanVietnameseWelshWest IndianYakamaYaquiYugoslavianYumanYup'ikZimbabwean
Immigration
NonimmigrantsImmigrantsAfghanistanAfricaAlbaniaArgentinaArmeniaAsiaAustraliaAustriaBahamasBangladeshBarbadosBelarusBelgiumBelizeBoliviaBosnia and HerzegovinaBrazilBulgariaBurma/MyanmarCabo VerdeCambodiaCameroonCanadaCaribbeanCentral AmericaChileChinaColombiaCongoCosta RicaCroatiaCubaCzechoslovakiaDenmarkDominicaDominican RepublicEastern AfricaEastern AsiaEastern EuropeEcuadorEgyptEl SalvadorEnglandEritreaEthiopiaEuropeFijiFranceGermanyGhanaGreeceGrenadaGuatemalaGuyanaHaitiHondurasHong KongHungaryIndiaIndonesiaIranIraqIrelandIsraelItalyJamaicaJapanJordanKazakhstanKenyaKoreaKuwaitLaosLatin AmericaLatviaLebanonLiberiaLithuaniaMalaysiaMexicoMicronesiaMiddle AfricaMoldovaMoroccoNepalNetherlandsNicaraguaNigeriaNorth AmericaNorthern AfricaNorthern EuropeNorwayOceaniaPakistanPanamaPeruPhilippinesPolandPortugalRomaniaRussiaSaudi ArabiaScotlandSenegalSerbiaSierra LeoneSingaporeSomaliaSouth AfricaSouth AmericaSouth Central AsiaSouth Eastern AsiaSouthern EuropeSpainSri LankaSt. Vincent and the GrenadinesSudanSwedenSwitzerlandSyriaTaiwanThailandTrinidad and TobagoTurkeyUgandaUkraineUruguayUzbekistanVenezuelaVietnamWest IndiesWestern AfricaWestern AsiaWestern EuropeYemenZaireZimbabweAzores
Immigrants from North Macedonia
Race
Ancestry
AfghanAfricanAlaska NativeAlaskan AthabascanAlbanianAleutAlsatianAmericanApacheArabArapahoArgentineanArmenianAssyrian/Chaldean/SyriacAustralianAustrianBahamianBangladeshiBarbadianBasqueBelgianBelizeanBermudanBhutaneseBlackfeetBolivianBrazilianBritishBritish West IndianBulgarianBurmeseCajunCambodianCanadianCape VerdeanCarpatho RusynCelticCentral AmericanCentral American IndianCherokeeCheyenneChickasawChileanChineseChippewaChoctawColombianColvilleComancheCosta RicanCreeCreekCroatianCrowCubanCypriotCzechCzechoslovakianDanishDelawareDominicanDutchDutch West IndianEastern EuropeanEcuadorianEgyptianEnglishEstonianEthiopianEuropeanFijianFilipinoFinnishFrenchFrench American IndianFrench CanadianGermanGerman RussianGhanaianGreekGuamanian/ChamorroGuatemalanGuyaneseHaitianHmongHonduranHopiHoumaHungarianIcelanderIndian (Asian)IndonesianInupiatIranianIraqiIrishIroquoisIsraeliItalianJamaicanJapaneseJordanianKenyanKiowaKoreanLaotianLatvianLebaneseLiberianLithuanianLumbeeLuxembourgerMacedonianMalaysianMalteseMarshalleseMenomineeMexicanMexican American IndianMongolianMoroccanNative HawaiianNavajoNepaleseNew ZealanderNicaraguanNigerianNorthern EuropeanNorwegianOkinawanOsageOttawaPaiutePakistaniPalestinianPanamanianParaguayanPennsylvania GermanPeruvianPimaPolishPortuguesePotawatomiPuebloPuerto RicanPuget Sound SalishRomanianRussianSalvadoranSamoanScandinavianScotch-IrishScottishSeminoleSenegaleseSerbianShoshoneSierra LeoneanSiouxSlavicSlovakSloveneSomaliSouth AfricanSouth AmericanSouth American IndianSoviet UnionSpaniardSpanishSpanish AmericanSpanish American IndianSri LankanSubsaharan AfricanSudaneseSwedishSwissSyrianTaiwaneseThaiTlingit-HaidaTohono O'OdhamTonganTrinidadian and TobagonianTsimshianTurkishU.S. Virgin IslanderUgandanUkrainianUruguayanUteVenezuelanVietnameseWelshWest IndianYakamaYaquiYugoslavianYumanYup'ikZimbabwean
Immigration
NonimmigrantsImmigrantsAfghanistanAfricaAlbaniaArgentinaArmeniaAsiaAustraliaAustriaBahamasBangladeshBarbadosBelarusBelgiumBelizeBoliviaBosnia and HerzegovinaBrazilBulgariaBurma/MyanmarCabo VerdeCambodiaCameroonCanadaCaribbeanCentral AmericaChileChinaColombiaCongoCosta RicaCroatiaCubaCzechoslovakiaDenmarkDominicaDominican RepublicEastern AfricaEastern AsiaEastern EuropeEcuadorEgyptEl SalvadorEnglandEritreaEthiopiaEuropeFijiFranceGermanyGhanaGreeceGrenadaGuatemalaGuyanaHaitiHondurasHong KongHungaryIndiaIndonesiaIranIraqIrelandIsraelItalyJamaicaJapanJordanKazakhstanKenyaKoreaKuwaitLaosLatin AmericaLatviaLebanonLiberiaMalaysiaMexicoMicronesiaMiddle AfricaMoldovaMoroccoNepalNetherlandsNicaraguaNigeriaNorth AmericaNorth MacedoniaNorthern AfricaNorthern EuropeNorwayOceaniaPakistanPanamaPeruPhilippinesPolandPortugalRomaniaRussiaSaudi ArabiaScotlandSenegalSerbiaSierra LeoneSingaporeSomaliaSouth AfricaSouth AmericaSouth Central AsiaSouth Eastern AsiaSouthern EuropeSpainSri LankaSt. Vincent and the GrenadinesSudanSwedenSwitzerlandSyriaTaiwanThailandTrinidad and TobagoTurkeyUgandaUkraineUruguayUzbekistanVenezuelaVietnamWest IndiesWestern AfricaWestern AsiaWestern EuropeYemenZaireZimbabweAzores
Unemployment
Income
Poverty
Unemployment
Labor Participation
Family Structure
Vehicle Availability
Education Level
Disability

Unemployment Comparison

Immigrants from Lithuania

Immigrants from North Macedonia

Exceptional
Exceptional
5.0%
UNEMPLOYMENT
93.2/ 100
METRIC RATING
110th/ 347
METRIC RANK
5.0%
UNEMPLOYMENT
96.3/ 100
METRIC RATING
90th/ 347
METRIC RANK

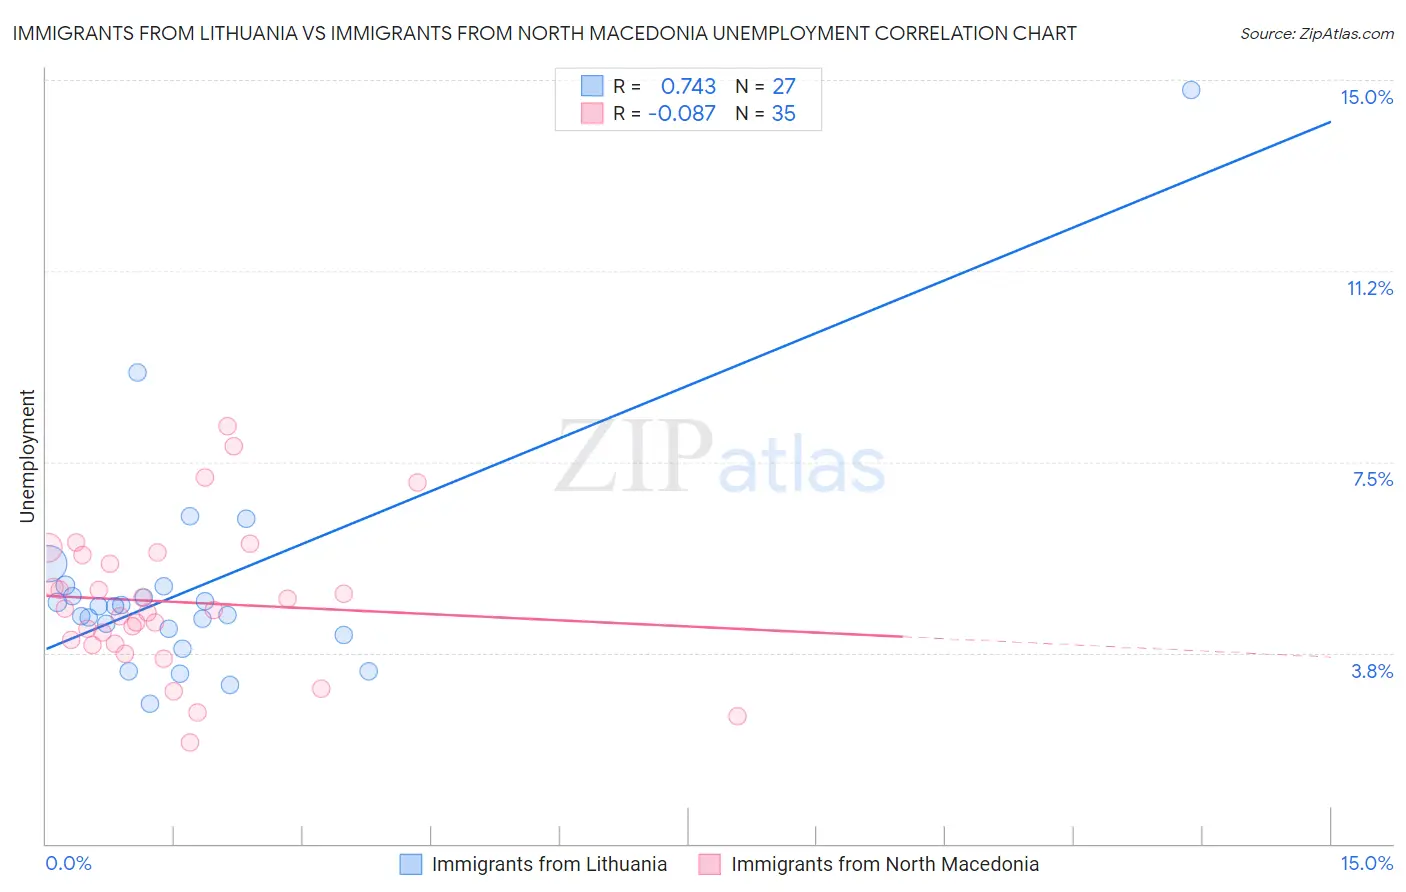
Immigrants from Lithuania vs Immigrants from North Macedonia Unemployment Correlation Chart

The statistical analysis conducted on geographies consisting of 117,711,175 people shows a strong positive correlation between the proportion of Immigrants from Lithuania and unemployment in the United States with a correlation coefficient (R) of 0.743 and weighted average of 5.0%. Similarly, the statistical analysis conducted on geographies consisting of 74,281,538 people shows a slight negative correlation between the proportion of Immigrants from North Macedonia and unemployment in the United States with a correlation coefficient (R) of -0.087 and weighted average of 5.0%, a difference of 1.0%.
Immigrants from Lithuania vs Immigrants from North Macedonia Unemployment

Unemployment Correlation Summary

MeasurementImmigrants from LithuaniaImmigrants from North Macedonia
Minimum2.7%2.0%
Maximum14.8%8.2%
Range12.1%6.2%
Mean5.0%4.7%
Median4.7%4.6%
Interquartile 25% (IQ1)4.1%3.9%
Interquartile 75% (IQ3)5.1%5.7%
Interquartile Range (IQR)0.96%1.8%
Standard Deviation (Sample)2.3%1.4%
Standard Deviation (Population)2.3%1.4%

Demographics Similar to Immigrants from Lithuania and Immigrants from North Macedonia by Unemployment

In terms of unemployment, the demographic groups most similar to Immigrants from Lithuania are Immigrants from Eritrea (5.0%, a difference of 0.020%), Immigrants from Kuwait (5.0%, a difference of 0.12%), Immigrants from Turkey (5.0%, a difference of 0.13%), Immigrants from Romania (5.0%, a difference of 0.14%), and Chickasaw (5.0%, a difference of 0.20%). Similarly, the demographic groups most similar to Immigrants from North Macedonia are Immigrants from Sudan (5.0%, a difference of 0.010%), Immigrants from South Africa (5.0%, a difference of 0.030%), Ukrainian (5.0%, a difference of 0.12%), Immigrants from Austria (5.0%, a difference of 0.16%), and Immigrants from Serbia (5.0%, a difference of 0.29%).
DemographicsRating | RankUnemployment
Immigrants | North Macedonia
96.3
/100
|
#90
Exceptional
5.0%
Immigrants | Sudan
96.3
/100
|
#91
Exceptional
5.0%
Immigrants | South Africa
96.2
/100
|
#92
Exceptional
5.0%
Ukrainians
96.0
/100
|
#93
Exceptional
5.0%
Immigrants | Austria
95.9
/100
|
#94
Exceptional
5.0%
Immigrants | Serbia
95.6
/100
|
#95
Exceptional
5.0%
Immigrants | England
95.2
/100
|
#96
Exceptional
5.0%
Immigrants | Czechoslovakia
95.1
/100
|
#97
Exceptional
5.0%
Romanians
95.0
/100
|
#98
Exceptional
5.0%
Mongolians
94.8
/100
|
#99
Exceptional
5.0%
Estonians
94.6
/100
|
#100
Exceptional
5.0%
Americans
94.3
/100
|
#101
Exceptional
5.0%
Immigrants | Argentina
94.1
/100
|
#102
Exceptional
5.0%
Chickasaw
94.0
/100
|
#103
Exceptional
5.0%
Osage
94.0
/100
|
#104
Exceptional
5.0%
Maltese
94.0
/100
|
#105
Exceptional
5.0%
Immigrants | Romania
93.7
/100
|
#106
Exceptional
5.0%
Immigrants | Turkey
93.7
/100
|
#107
Exceptional
5.0%
Immigrants | Kuwait
93.7
/100
|
#108
Exceptional
5.0%
Immigrants | Eritrea
93.3
/100
|
#109
Exceptional
5.0%
Immigrants | Lithuania
93.2
/100
|
#110
Exceptional
5.0%