Immigrants from Liberia vs Immigrants from Sweden Unemployment Among Youth under 25 years
COMPARE
Immigrants from Liberia
Immigrants from Sweden
Unemployment Among Youth under 25 years
Unemployment Among Youth under 25 years Comparison
Immigrants from Liberia
Immigrants from Sweden
12.8%
UNEMPLOYMENT AMONG YOUTH UNDER 25 YEARS
0.0/ 100
METRIC RATING
270th/ 347
METRIC RANK
11.5%
UNEMPLOYMENT AMONG YOUTH UNDER 25 YEARS
61.3/ 100
METRIC RATING
165th/ 347
METRIC RANK
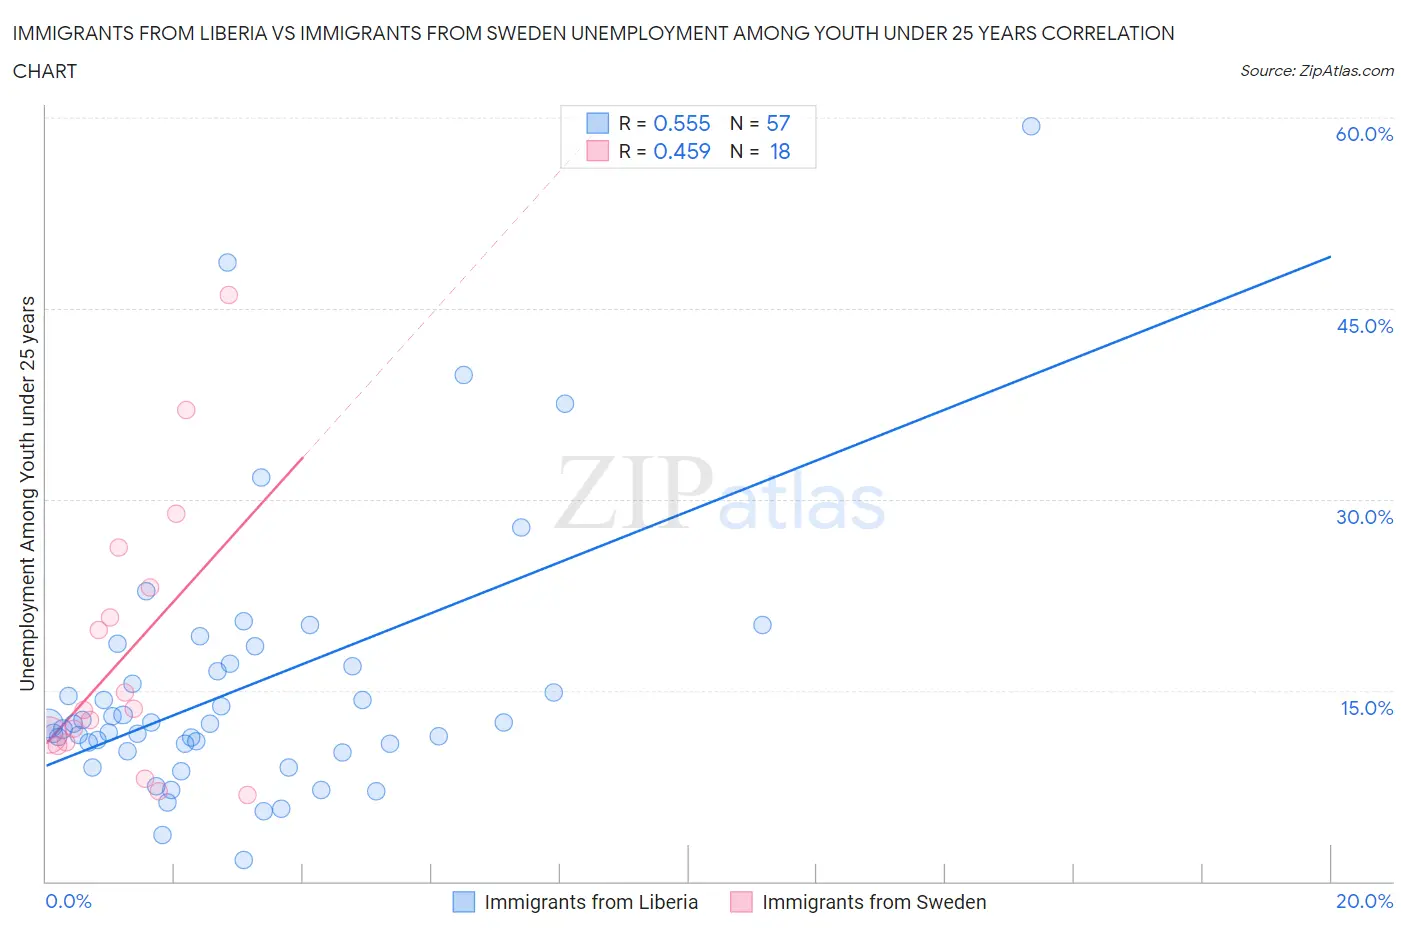
Immigrants from Liberia vs Immigrants from Sweden Unemployment Among Youth under 25 years Correlation Chart
The statistical analysis conducted on geographies consisting of 134,836,783 people shows a substantial positive correlation between the proportion of Immigrants from Liberia and unemployment rate among youth under the age of 25 in the United States with a correlation coefficient (R) of 0.555 and weighted average of 12.8%. Similarly, the statistical analysis conducted on geographies consisting of 163,767,468 people shows a moderate positive correlation between the proportion of Immigrants from Sweden and unemployment rate among youth under the age of 25 in the United States with a correlation coefficient (R) of 0.459 and weighted average of 11.5%, a difference of 11.0%.
Unemployment Among Youth under 25 years Correlation Summary
| Measurement | Immigrants from Liberia | Immigrants from Sweden |
| Minimum | 1.7% | 6.8% |
| Maximum | 59.3% | 46.1% |
| Range | 57.6% | 39.3% |
| Mean | 15.2% | 18.0% |
| Median | 12.4% | 13.5% |
| Interquartile 25% (IQ1) | 10.5% | 10.9% |
| Interquartile 75% (IQ3) | 17.0% | 23.1% |
| Interquartile Range (IQR) | 6.5% | 12.2% |
| Standard Deviation (Sample) | 10.4% | 10.8% |
| Standard Deviation (Population) | 10.3% | 10.5% |
Similar Demographics by Unemployment Among Youth under 25 years
Demographics Similar to Immigrants from Liberia by Unemployment Among Youth under 25 years
In terms of unemployment among youth under 25 years, the demographic groups most similar to Immigrants from Liberia are Immigrants from Bahamas (12.9%, a difference of 0.53%), Cape Verdean (12.9%, a difference of 0.75%), Nigerian (13.0%, a difference of 1.1%), Kiowa (12.7%, a difference of 1.1%), and Tlingit-Haida (12.7%, a difference of 1.3%).
| Demographics | Rating | Rank | Unemployment Among Youth under 25 years |
| Cree | 0.1 /100 | #263 | Tragic 12.4% |
| Puget Sound Salish | 0.1 /100 | #264 | Tragic 12.5% |
| Nepalese | 0.0 /100 | #265 | Tragic 12.5% |
| Immigrants | Latin America | 0.0 /100 | #266 | Tragic 12.6% |
| Sub-Saharan Africans | 0.0 /100 | #267 | Tragic 12.6% |
| Tlingit-Haida | 0.0 /100 | #268 | Tragic 12.7% |
| Kiowa | 0.0 /100 | #269 | Tragic 12.7% |
| Immigrants | Liberia | 0.0 /100 | #270 | Tragic 12.8% |
| Immigrants | Bahamas | 0.0 /100 | #271 | Tragic 12.9% |
| Cape Verdeans | 0.0 /100 | #272 | Tragic 12.9% |
| Nigerians | 0.0 /100 | #273 | Tragic 13.0% |
| Immigrants | Nigeria | 0.0 /100 | #274 | Tragic 13.0% |
| Bermudans | 0.0 /100 | #275 | Tragic 13.0% |
| Immigrants | Uzbekistan | 0.0 /100 | #276 | Tragic 13.1% |
| Bahamians | 0.0 /100 | #277 | Tragic 13.1% |
Demographics Similar to Immigrants from Sweden by Unemployment Among Youth under 25 years
In terms of unemployment among youth under 25 years, the demographic groups most similar to Immigrants from Sweden are Spanish (11.6%, a difference of 0.040%), Immigrants from Laos (11.5%, a difference of 0.050%), Immigrants from Northern Africa (11.5%, a difference of 0.060%), Immigrants from Kazakhstan (11.5%, a difference of 0.060%), and Okinawan (11.6%, a difference of 0.11%).
| Demographics | Rating | Rank | Unemployment Among Youth under 25 years |
| Immigrants | Turkey | 64.8 /100 | #158 | Good 11.5% |
| Immigrants | Western Europe | 64.7 /100 | #159 | Good 11.5% |
| Immigrants | Eastern Asia | 64.5 /100 | #160 | Good 11.5% |
| Ukrainians | 64.3 /100 | #161 | Good 11.5% |
| Immigrants | Northern Africa | 62.7 /100 | #162 | Good 11.5% |
| Immigrants | Kazakhstan | 62.7 /100 | #163 | Good 11.5% |
| Immigrants | Laos | 62.4 /100 | #164 | Good 11.5% |
| Immigrants | Sweden | 61.3 /100 | #165 | Good 11.5% |
| Spanish | 60.3 /100 | #166 | Good 11.6% |
| Okinawans | 58.7 /100 | #167 | Average 11.6% |
| Potawatomi | 57.9 /100 | #168 | Average 11.6% |
| Eastern Europeans | 57.5 /100 | #169 | Average 11.6% |
| Russians | 57.3 /100 | #170 | Average 11.6% |
| Bangladeshis | 55.6 /100 | #171 | Average 11.6% |
| Immigrants | Morocco | 55.1 /100 | #172 | Average 11.6% |