Immigrants from Panama vs Dutch West Indian Unemployment Among Youth under 25 years
COMPARE
Immigrants from Panama
Dutch West Indian
Unemployment Among Youth under 25 years
Unemployment Among Youth under 25 years Comparison
Immigrants from Panama
Dutch West Indians
12.4%
UNEMPLOYMENT AMONG YOUTH UNDER 25 YEARS
0.1/ 100
METRIC RATING
260th/ 347
METRIC RANK
12.1%
UNEMPLOYMENT AMONG YOUTH UNDER 25 YEARS
1.1/ 100
METRIC RATING
240th/ 347
METRIC RANK
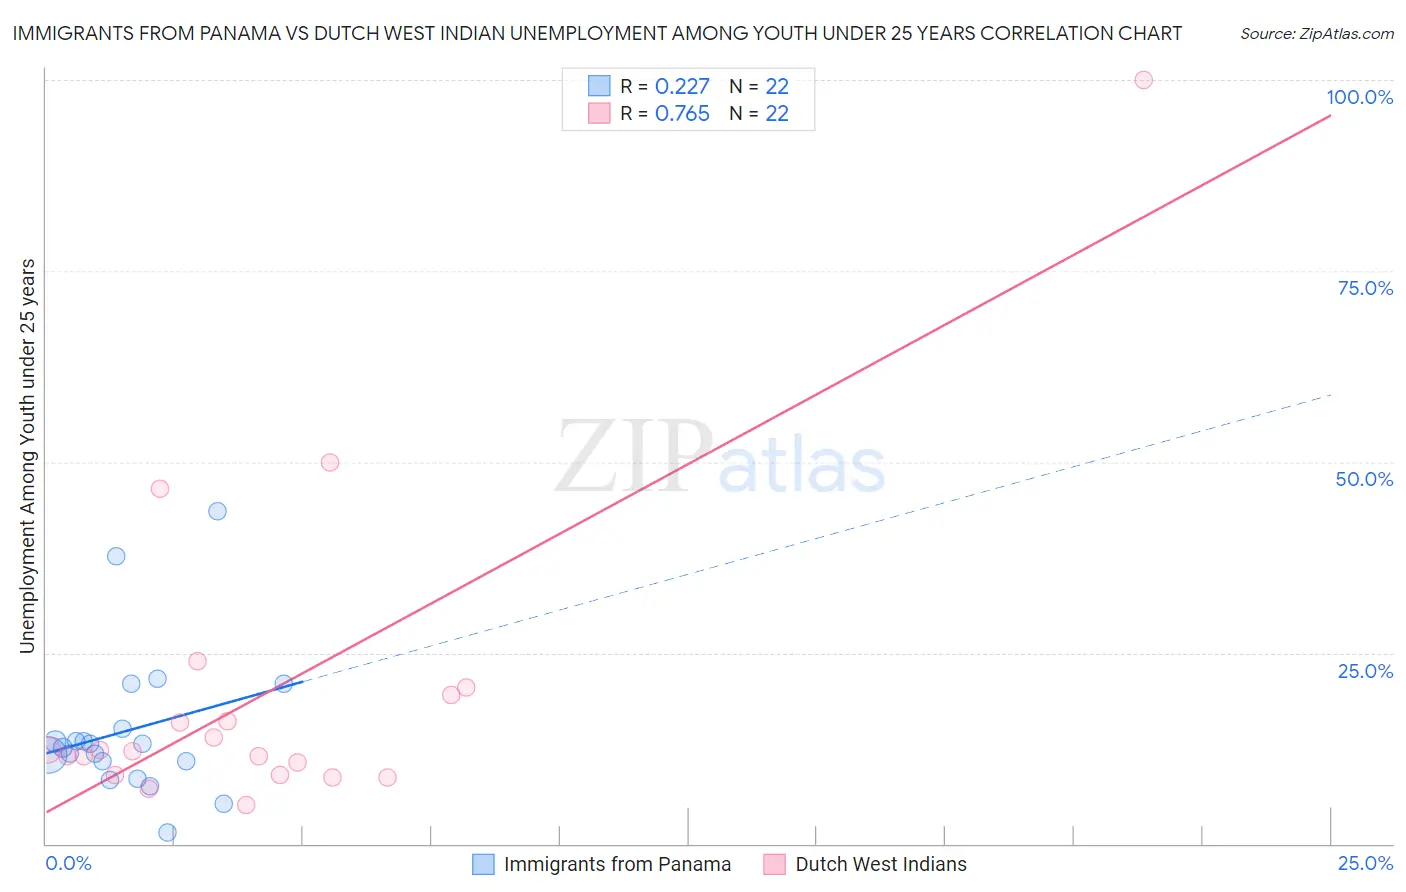
Immigrants from Panama vs Dutch West Indian Unemployment Among Youth under 25 years Correlation Chart
The statistical analysis conducted on geographies consisting of 220,278,494 people shows a weak positive correlation between the proportion of Immigrants from Panama and unemployment rate among youth under the age of 25 in the United States with a correlation coefficient (R) of 0.227 and weighted average of 12.4%. Similarly, the statistical analysis conducted on geographies consisting of 85,012,533 people shows a strong positive correlation between the proportion of Dutch West Indians and unemployment rate among youth under the age of 25 in the United States with a correlation coefficient (R) of 0.765 and weighted average of 12.1%, a difference of 2.4%.
Unemployment Among Youth under 25 years Correlation Summary
| Measurement | Immigrants from Panama | Dutch West Indian |
| Minimum | 1.5% | 5.1% |
| Maximum | 43.6% | 100.0% |
| Range | 42.1% | 94.9% |
| Mean | 14.9% | 19.8% |
| Median | 12.8% | 12.1% |
| Interquartile 25% (IQ1) | 10.8% | 9.1% |
| Interquartile 75% (IQ3) | 15.0% | 19.5% |
| Interquartile Range (IQR) | 4.2% | 10.4% |
| Standard Deviation (Sample) | 9.6% | 21.2% |
| Standard Deviation (Population) | 9.4% | 20.7% |
Demographics Similar to Immigrants from Panama and Dutch West Indians by Unemployment Among Youth under 25 years
In terms of unemployment among youth under 25 years, the demographic groups most similar to Immigrants from Panama are Immigrants from Central America (12.4%, a difference of 0.30%), Salvadoran (12.4%, a difference of 0.35%), Panamanian (12.4%, a difference of 0.38%), Liberian (12.4%, a difference of 0.39%), and Hispanic or Latino (12.4%, a difference of 0.47%). Similarly, the demographic groups most similar to Dutch West Indians are Immigrants from Albania (12.1%, a difference of 0.020%), Immigrants from Western Asia (12.2%, a difference of 0.34%), Immigrants from the Azores (12.2%, a difference of 0.54%), Alaskan Athabascan (12.2%, a difference of 0.54%), and Spanish American (12.2%, a difference of 0.55%).
| Demographics | Rating | Rank | Unemployment Among Youth under 25 years |
| Dutch West Indians | 1.1 /100 | #240 | Tragic 12.1% |
| Immigrants | Albania | 1.1 /100 | #241 | Tragic 12.1% |
| Immigrants | Western Asia | 0.8 /100 | #242 | Tragic 12.2% |
| Immigrants | Azores | 0.6 /100 | #243 | Tragic 12.2% |
| Alaskan Athabascans | 0.6 /100 | #244 | Tragic 12.2% |
| Spanish Americans | 0.6 /100 | #245 | Tragic 12.2% |
| Immigrants | Honduras | 0.6 /100 | #246 | Tragic 12.2% |
| Immigrants | Greece | 0.6 /100 | #247 | Tragic 12.2% |
| Central Americans | 0.6 /100 | #248 | Tragic 12.2% |
| Soviet Union | 0.6 /100 | #249 | Tragic 12.2% |
| Delaware | 0.4 /100 | #250 | Tragic 12.3% |
| Mexican American Indians | 0.4 /100 | #251 | Tragic 12.3% |
| Immigrants | Syria | 0.3 /100 | #252 | Tragic 12.3% |
| Mexicans | 0.3 /100 | #253 | Tragic 12.3% |
| Hondurans | 0.3 /100 | #254 | Tragic 12.3% |
| Hispanics or Latinos | 0.2 /100 | #255 | Tragic 12.4% |
| Liberians | 0.2 /100 | #256 | Tragic 12.4% |
| Panamanians | 0.2 /100 | #257 | Tragic 12.4% |
| Salvadorans | 0.1 /100 | #258 | Tragic 12.4% |
| Immigrants | Central America | 0.1 /100 | #259 | Tragic 12.4% |
| Immigrants | Panama | 0.1 /100 | #260 | Tragic 12.4% |