Immigrants from Latin America vs Lithuanian Unemployment
COMPARE
Immigrants from Latin America
Lithuanian
Unemployment
Unemployment Comparison
Immigrants from Latin America
Lithuanians
5.9%
UNEMPLOYMENT
0.0/ 100
METRIC RATING
275th/ 347
METRIC RANK
4.8%
UNEMPLOYMENT
99.7/ 100
METRIC RATING
39th/ 347
METRIC RANK
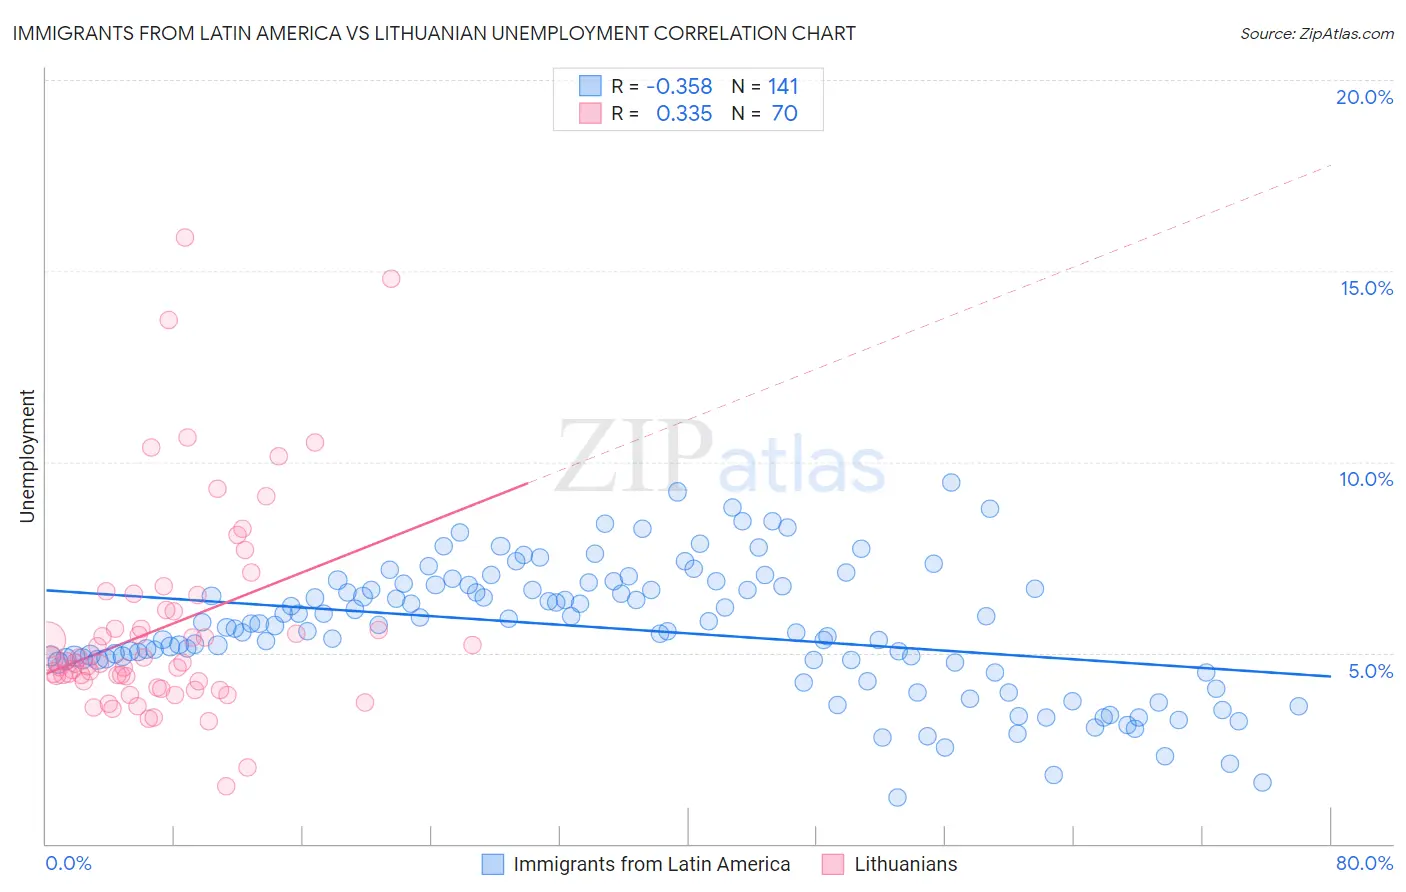
Immigrants from Latin America vs Lithuanian Unemployment Correlation Chart
The statistical analysis conducted on geographies consisting of 555,896,337 people shows a mild negative correlation between the proportion of Immigrants from Latin America and unemployment in the United States with a correlation coefficient (R) of -0.358 and weighted average of 5.9%. Similarly, the statistical analysis conducted on geographies consisting of 421,273,270 people shows a mild positive correlation between the proportion of Lithuanians and unemployment in the United States with a correlation coefficient (R) of 0.335 and weighted average of 4.8%, a difference of 23.8%.
Unemployment Correlation Summary
| Measurement | Immigrants from Latin America | Lithuanian |
| Minimum | 1.2% | 1.5% |
| Maximum | 9.5% | 15.9% |
| Range | 8.3% | 14.4% |
| Mean | 5.6% | 5.7% |
| Median | 5.7% | 4.7% |
| Interquartile 25% (IQ1) | 4.8% | 4.3% |
| Interquartile 75% (IQ3) | 6.8% | 6.1% |
| Interquartile Range (IQR) | 2.0% | 1.9% |
| Standard Deviation (Sample) | 1.7% | 2.7% |
| Standard Deviation (Population) | 1.7% | 2.7% |
Similar Demographics by Unemployment
Demographics Similar to Immigrants from Latin America by Unemployment
In terms of unemployment, the demographic groups most similar to Immigrants from Latin America are Bahamian (5.9%, a difference of 0.21%), Immigrants from Central America (6.0%, a difference of 0.28%), Immigrants from Fiji (5.9%, a difference of 0.50%), Armenian (6.0%, a difference of 0.63%), and Hispanic or Latino (5.9%, a difference of 0.67%).
| Demographics | Rating | Rank | Unemployment |
| Immigrants | Sierra Leone | 0.1 /100 | #268 | Tragic 5.8% |
| Immigrants | El Salvador | 0.1 /100 | #269 | Tragic 5.8% |
| Blackfeet | 0.1 /100 | #270 | Tragic 5.8% |
| Mexicans | 0.1 /100 | #271 | Tragic 5.9% |
| Hispanics or Latinos | 0.0 /100 | #272 | Tragic 5.9% |
| Immigrants | Fiji | 0.0 /100 | #273 | Tragic 5.9% |
| Bahamians | 0.0 /100 | #274 | Tragic 5.9% |
| Immigrants | Latin America | 0.0 /100 | #275 | Tragic 5.9% |
| Immigrants | Central America | 0.0 /100 | #276 | Tragic 6.0% |
| Armenians | 0.0 /100 | #277 | Tragic 6.0% |
| Ghanaians | 0.0 /100 | #278 | Tragic 6.0% |
| Immigrants | Mexico | 0.0 /100 | #279 | Tragic 6.0% |
| Immigrants | Western Africa | 0.0 /100 | #280 | Tragic 6.0% |
| Africans | 0.0 /100 | #281 | Tragic 6.1% |
| Immigrants | Azores | 0.0 /100 | #282 | Tragic 6.1% |
Demographics Similar to Lithuanians by Unemployment
In terms of unemployment, the demographic groups most similar to Lithuanians are Northern European (4.8%, a difference of 0.020%), Immigrants from Bosnia and Herzegovina (4.8%, a difference of 0.040%), Bolivian (4.8%, a difference of 0.14%), Czechoslovakian (4.8%, a difference of 0.34%), and Tongan (4.8%, a difference of 0.41%).
| Demographics | Rating | Rank | Unemployment |
| Zimbabweans | 99.8 /100 | #32 | Exceptional 4.8% |
| Sudanese | 99.8 /100 | #33 | Exceptional 4.8% |
| Immigrants | Bolivia | 99.8 /100 | #34 | Exceptional 4.8% |
| Scotch-Irish | 99.8 /100 | #35 | Exceptional 4.8% |
| Tongans | 99.7 /100 | #36 | Exceptional 4.8% |
| Czechoslovakians | 99.7 /100 | #37 | Exceptional 4.8% |
| Bolivians | 99.7 /100 | #38 | Exceptional 4.8% |
| Lithuanians | 99.7 /100 | #39 | Exceptional 4.8% |
| Northern Europeans | 99.7 /100 | #40 | Exceptional 4.8% |
| Immigrants | Bosnia and Herzegovina | 99.7 /100 | #41 | Exceptional 4.8% |
| Filipinos | 99.5 /100 | #42 | Exceptional 4.8% |
| Yugoslavians | 99.5 /100 | #43 | Exceptional 4.8% |
| Austrians | 99.5 /100 | #44 | Exceptional 4.8% |
| French | 99.5 /100 | #45 | Exceptional 4.8% |
| Immigrants | Nepal | 99.4 /100 | #46 | Exceptional 4.8% |