Immigrants from Laos vs Venezuelan Unemployment Among Ages 55 to 59 years
COMPARE
Immigrants from Laos
Venezuelan
Unemployment Among Ages 55 to 59 years
Unemployment Among Ages 55 to 59 years Comparison
Immigrants from Laos
Venezuelans
4.7%
UNEMPLOYMENT AMONG AGES 55 TO 59 YEARS
93.9/ 100
METRIC RATING
106th/ 347
METRIC RANK
4.2%
UNEMPLOYMENT AMONG AGES 55 TO 59 YEARS
100.0/ 100
METRIC RATING
4th/ 347
METRIC RANK
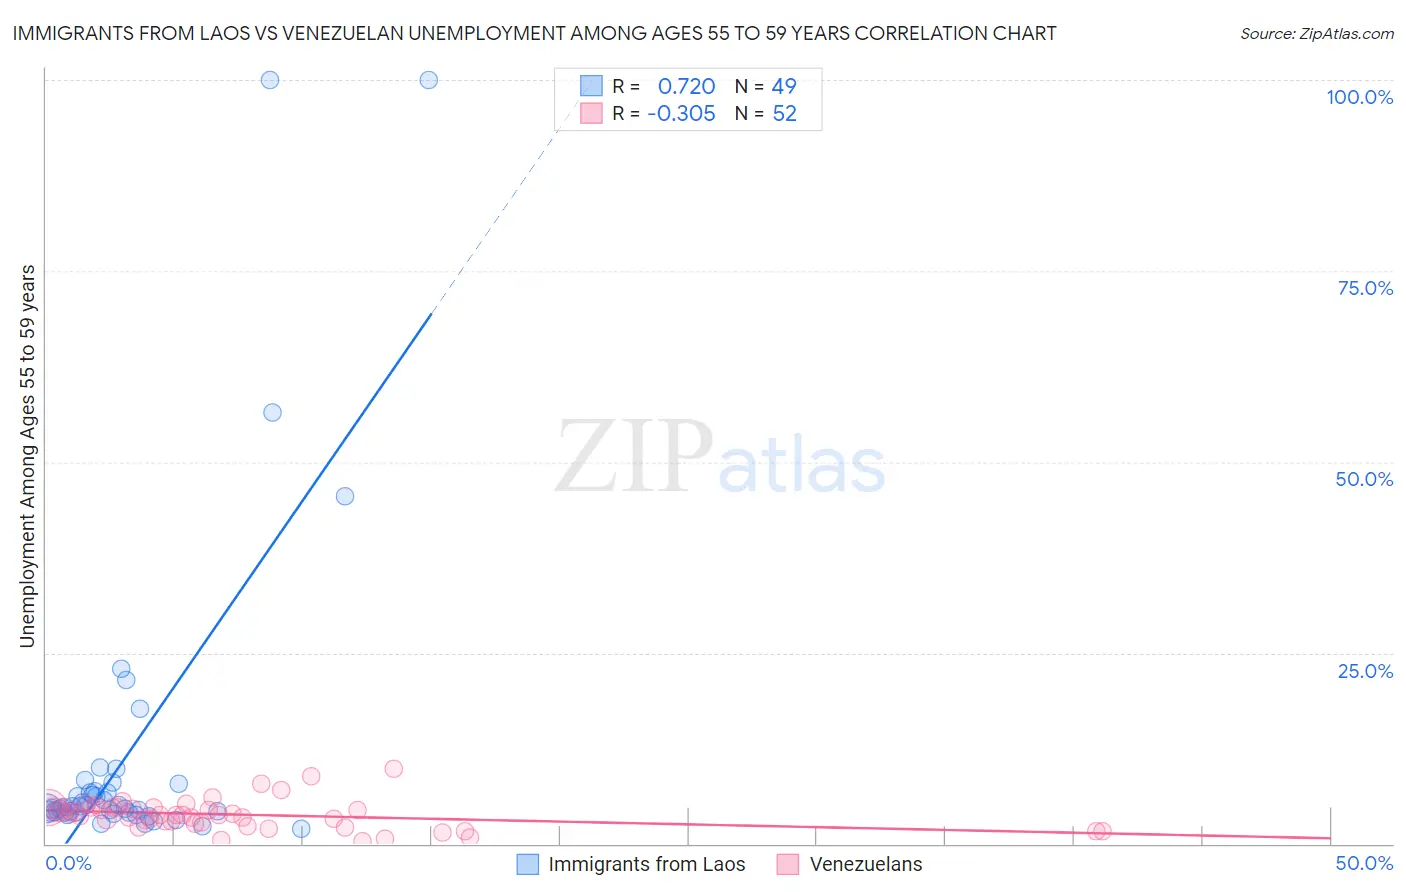
Immigrants from Laos vs Venezuelan Unemployment Among Ages 55 to 59 years Correlation Chart
The statistical analysis conducted on geographies consisting of 193,806,599 people shows a strong positive correlation between the proportion of Immigrants from Laos and unemployment rate among population between the ages 55 and 59 in the United States with a correlation coefficient (R) of 0.720 and weighted average of 4.7%. Similarly, the statistical analysis conducted on geographies consisting of 290,130,641 people shows a mild negative correlation between the proportion of Venezuelans and unemployment rate among population between the ages 55 and 59 in the United States with a correlation coefficient (R) of -0.305 and weighted average of 4.2%, a difference of 12.6%.
Unemployment Among Ages 55 to 59 years Correlation Summary
| Measurement | Immigrants from Laos | Venezuelan |
| Minimum | 2.0% | 0.40% |
| Maximum | 100.0% | 9.9% |
| Range | 98.0% | 9.5% |
| Mean | 11.7% | 3.8% |
| Median | 4.7% | 3.8% |
| Interquartile 25% (IQ1) | 4.1% | 2.7% |
| Interquartile 75% (IQ3) | 7.4% | 4.7% |
| Interquartile Range (IQR) | 3.2% | 2.0% |
| Standard Deviation (Sample) | 20.9% | 1.9% |
| Standard Deviation (Population) | 20.7% | 1.9% |
Similar Demographics by Unemployment Among Ages 55 to 59 years
Demographics Similar to Immigrants from Laos by Unemployment Among Ages 55 to 59 years
In terms of unemployment among ages 55 to 59 years, the demographic groups most similar to Immigrants from Laos are Immigrants from North America (4.7%, a difference of 0.010%), Immigrants from Turkey (4.7%, a difference of 0.020%), Canadian (4.7%, a difference of 0.040%), Immigrants from Oceania (4.7%, a difference of 0.040%), and Immigrants from Egypt (4.7%, a difference of 0.060%).
| Demographics | Rating | Rank | Unemployment Among Ages 55 to 59 years |
| Yugoslavians | 94.7 /100 | #99 | Exceptional 4.7% |
| Serbians | 94.4 /100 | #100 | Exceptional 4.7% |
| Celtics | 94.3 /100 | #101 | Exceptional 4.7% |
| Canadians | 94.1 /100 | #102 | Exceptional 4.7% |
| Immigrants | Oceania | 94.0 /100 | #103 | Exceptional 4.7% |
| Immigrants | Turkey | 93.9 /100 | #104 | Exceptional 4.7% |
| Immigrants | North America | 93.9 /100 | #105 | Exceptional 4.7% |
| Immigrants | Laos | 93.9 /100 | #106 | Exceptional 4.7% |
| Immigrants | Egypt | 93.5 /100 | #107 | Exceptional 4.7% |
| French | 93.3 /100 | #108 | Exceptional 4.7% |
| Chileans | 93.2 /100 | #109 | Exceptional 4.7% |
| Egyptians | 92.9 /100 | #110 | Exceptional 4.7% |
| Austrians | 92.4 /100 | #111 | Exceptional 4.7% |
| Afghans | 92.1 /100 | #112 | Exceptional 4.7% |
| Immigrants | Spain | 91.4 /100 | #113 | Exceptional 4.7% |
Demographics Similar to Venezuelans by Unemployment Among Ages 55 to 59 years
In terms of unemployment among ages 55 to 59 years, the demographic groups most similar to Venezuelans are Immigrants from Bolivia (4.2%, a difference of 0.54%), Norwegian (4.2%, a difference of 1.1%), Zimbabwean (4.2%, a difference of 1.7%), Bolivian (4.2%, a difference of 1.8%), and Immigrants from Venezuela (4.1%, a difference of 1.9%).
| Demographics | Rating | Rank | Unemployment Among Ages 55 to 59 years |
| Fijians | 100.0 /100 | #1 | Exceptional 4.1% |
| Immigrants | Cuba | 100.0 /100 | #2 | Exceptional 4.1% |
| Immigrants | Venezuela | 100.0 /100 | #3 | Exceptional 4.1% |
| Venezuelans | 100.0 /100 | #4 | Exceptional 4.2% |
| Immigrants | Bolivia | 100.0 /100 | #5 | Exceptional 4.2% |
| Norwegians | 100.0 /100 | #6 | Exceptional 4.2% |
| Zimbabweans | 100.0 /100 | #7 | Exceptional 4.2% |
| Bolivians | 100.0 /100 | #8 | Exceptional 4.2% |
| Cubans | 100.0 /100 | #9 | Exceptional 4.2% |
| Tongans | 100.0 /100 | #10 | Exceptional 4.3% |
| Immigrants | Congo | 100.0 /100 | #11 | Exceptional 4.3% |
| Danes | 100.0 /100 | #12 | Exceptional 4.3% |
| Indonesians | 100.0 /100 | #13 | Exceptional 4.3% |
| Immigrants | India | 100.0 /100 | #14 | Exceptional 4.3% |
| Bulgarians | 100.0 /100 | #15 | Exceptional 4.3% |