Immigrants from Laos vs Nonimmigrants Unemployment Among Ages 55 to 59 years
COMPARE
Immigrants from Laos
Nonimmigrants
Unemployment Among Ages 55 to 59 years
Unemployment Among Ages 55 to 59 years Comparison
Immigrants from Laos
Nonimmigrants
4.7%
UNEMPLOYMENT AMONG AGES 55 TO 59 YEARS
93.9/ 100
METRIC RATING
106th/ 347
METRIC RANK
4.9%
UNEMPLOYMENT AMONG AGES 55 TO 59 YEARS
11.2/ 100
METRIC RATING
212th/ 347
METRIC RANK
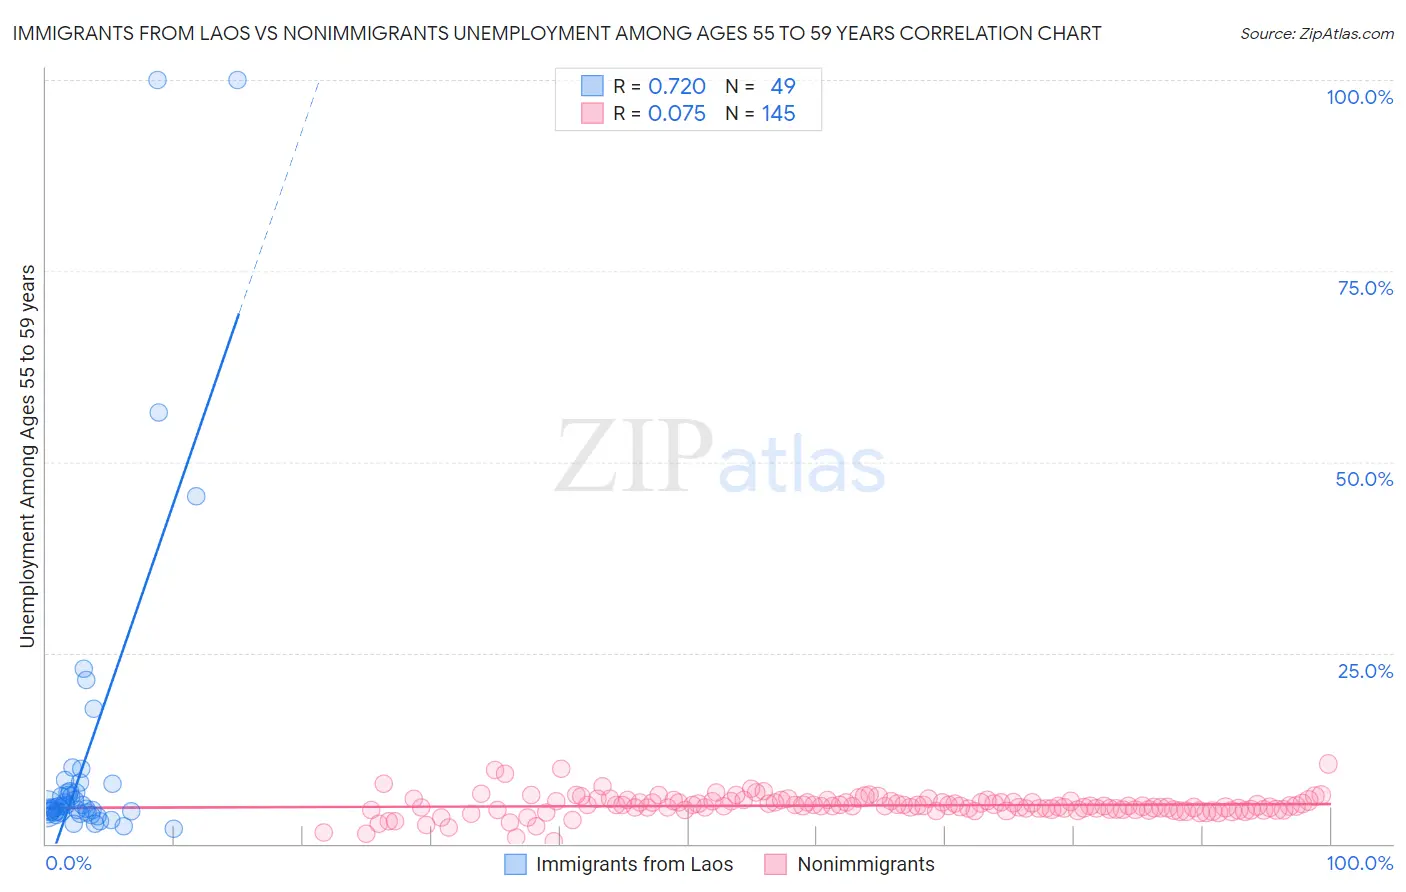
Immigrants from Laos vs Nonimmigrants Unemployment Among Ages 55 to 59 years Correlation Chart
The statistical analysis conducted on geographies consisting of 193,806,599 people shows a strong positive correlation between the proportion of Immigrants from Laos and unemployment rate among population between the ages 55 and 59 in the United States with a correlation coefficient (R) of 0.720 and weighted average of 4.7%. Similarly, the statistical analysis conducted on geographies consisting of 492,378,712 people shows a slight positive correlation between the proportion of Nonimmigrants and unemployment rate among population between the ages 55 and 59 in the United States with a correlation coefficient (R) of 0.075 and weighted average of 4.9%, a difference of 5.0%.
Unemployment Among Ages 55 to 59 years Correlation Summary
| Measurement | Immigrants from Laos | Nonimmigrants |
| Minimum | 2.0% | 0.40% |
| Maximum | 100.0% | 10.4% |
| Range | 98.0% | 10.0% |
| Mean | 11.7% | 5.0% |
| Median | 4.7% | 4.9% |
| Interquartile 25% (IQ1) | 4.1% | 4.5% |
| Interquartile 75% (IQ3) | 7.4% | 5.5% |
| Interquartile Range (IQR) | 3.2% | 1.1% |
| Standard Deviation (Sample) | 20.9% | 1.4% |
| Standard Deviation (Population) | 20.7% | 1.4% |
Similar Demographics by Unemployment Among Ages 55 to 59 years
Demographics Similar to Immigrants from Laos by Unemployment Among Ages 55 to 59 years
In terms of unemployment among ages 55 to 59 years, the demographic groups most similar to Immigrants from Laos are Immigrants from North America (4.7%, a difference of 0.010%), Immigrants from Turkey (4.7%, a difference of 0.020%), Canadian (4.7%, a difference of 0.040%), Immigrants from Oceania (4.7%, a difference of 0.040%), and Immigrants from Egypt (4.7%, a difference of 0.060%).
| Demographics | Rating | Rank | Unemployment Among Ages 55 to 59 years |
| Yugoslavians | 94.7 /100 | #99 | Exceptional 4.7% |
| Serbians | 94.4 /100 | #100 | Exceptional 4.7% |
| Celtics | 94.3 /100 | #101 | Exceptional 4.7% |
| Canadians | 94.1 /100 | #102 | Exceptional 4.7% |
| Immigrants | Oceania | 94.0 /100 | #103 | Exceptional 4.7% |
| Immigrants | Turkey | 93.9 /100 | #104 | Exceptional 4.7% |
| Immigrants | North America | 93.9 /100 | #105 | Exceptional 4.7% |
| Immigrants | Laos | 93.9 /100 | #106 | Exceptional 4.7% |
| Immigrants | Egypt | 93.5 /100 | #107 | Exceptional 4.7% |
| French | 93.3 /100 | #108 | Exceptional 4.7% |
| Chileans | 93.2 /100 | #109 | Exceptional 4.7% |
| Egyptians | 92.9 /100 | #110 | Exceptional 4.7% |
| Austrians | 92.4 /100 | #111 | Exceptional 4.7% |
| Afghans | 92.1 /100 | #112 | Exceptional 4.7% |
| Immigrants | Spain | 91.4 /100 | #113 | Exceptional 4.7% |
Demographics Similar to Nonimmigrants by Unemployment Among Ages 55 to 59 years
In terms of unemployment among ages 55 to 59 years, the demographic groups most similar to Nonimmigrants are Bermudan (4.9%, a difference of 0.020%), Immigrants from Denmark (4.9%, a difference of 0.090%), Creek (4.9%, a difference of 0.16%), Hawaiian (4.9%, a difference of 0.16%), and Immigrants from Haiti (4.9%, a difference of 0.20%).
| Demographics | Rating | Rank | Unemployment Among Ages 55 to 59 years |
| Haitians | 18.1 /100 | #205 | Poor 4.9% |
| Immigrants | Belarus | 14.1 /100 | #206 | Poor 4.9% |
| Immigrants | Australia | 14.1 /100 | #207 | Poor 4.9% |
| Immigrants | Kazakhstan | 14.0 /100 | #208 | Poor 4.9% |
| Immigrants | Haiti | 13.3 /100 | #209 | Poor 4.9% |
| Creek | 12.9 /100 | #210 | Poor 4.9% |
| Hawaiians | 12.8 /100 | #211 | Poor 4.9% |
| Immigrants | Nonimmigrants | 11.2 /100 | #212 | Poor 4.9% |
| Bermudans | 11.0 /100 | #213 | Poor 4.9% |
| Immigrants | Denmark | 10.3 /100 | #214 | Poor 4.9% |
| Syrians | 8.6 /100 | #215 | Tragic 4.9% |
| Spanish Americans | 8.1 /100 | #216 | Tragic 4.9% |
| Immigrants | Brazil | 8.1 /100 | #217 | Tragic 4.9% |
| Immigrants | Austria | 8.0 /100 | #218 | Tragic 4.9% |
| Immigrants | Nigeria | 8.0 /100 | #219 | Tragic 4.9% |