Yup'ik vs Immigrants from Hong Kong Unemployment Among Ages 55 to 59 years
COMPARE
Yup'ik
Immigrants from Hong Kong
Unemployment Among Ages 55 to 59 years
Unemployment Among Ages 55 to 59 years Comparison
Yup'ik
Immigrants from Hong Kong
13.9%
UNEMPLOYMENT AMONG AGES 55 TO 59 YEARS
0.0/ 100
METRIC RATING
347th/ 347
METRIC RANK
5.0%
UNEMPLOYMENT AMONG AGES 55 TO 59 YEARS
1.4/ 100
METRIC RATING
235th/ 347
METRIC RANK
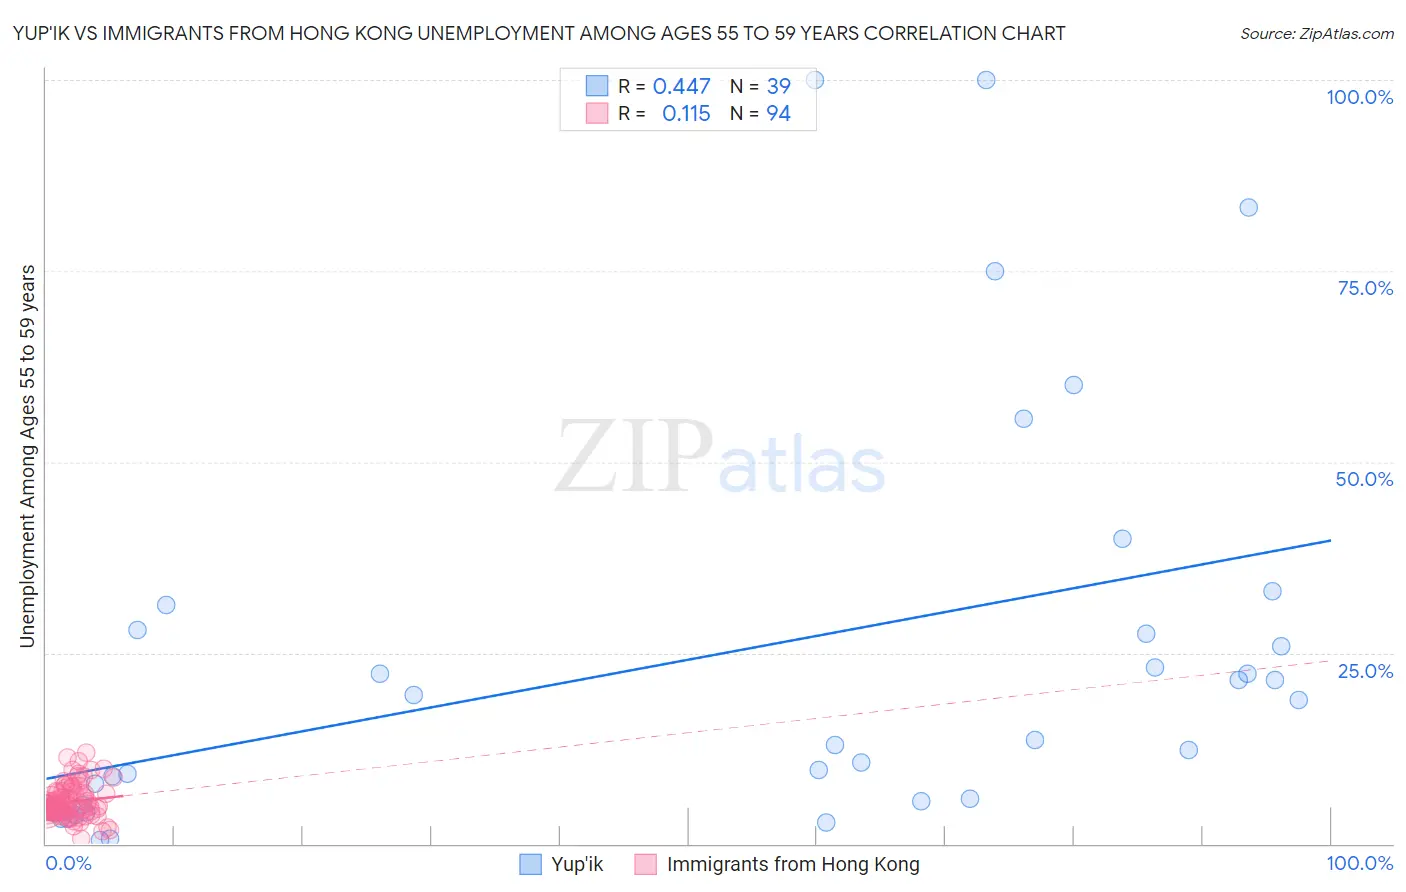
Yup'ik vs Immigrants from Hong Kong Unemployment Among Ages 55 to 59 years Correlation Chart
The statistical analysis conducted on geographies consisting of 39,073,104 people shows a moderate positive correlation between the proportion of Yup'ik and unemployment rate among population between the ages 55 and 59 in the United States with a correlation coefficient (R) of 0.447 and weighted average of 13.9%. Similarly, the statistical analysis conducted on geographies consisting of 245,156,987 people shows a poor positive correlation between the proportion of Immigrants from Hong Kong and unemployment rate among population between the ages 55 and 59 in the United States with a correlation coefficient (R) of 0.115 and weighted average of 5.0%, a difference of 177.3%.
Unemployment Among Ages 55 to 59 years Correlation Summary
| Measurement | Yup'ik | Immigrants from Hong Kong |
| Minimum | 0.49% | 0.60% |
| Maximum | 100.0% | 11.9% |
| Range | 99.5% | 11.3% |
| Mean | 24.0% | 5.5% |
| Median | 13.6% | 4.9% |
| Interquartile 25% (IQ1) | 5.0% | 4.4% |
| Interquartile 75% (IQ3) | 28.0% | 6.6% |
| Interquartile Range (IQR) | 23.0% | 2.3% |
| Standard Deviation (Sample) | 26.6% | 2.1% |
| Standard Deviation (Population) | 26.3% | 2.1% |
Similar Demographics by Unemployment Among Ages 55 to 59 years
Demographics Similar to Yup'ik by Unemployment Among Ages 55 to 59 years
In terms of unemployment among ages 55 to 59 years, the demographic groups most similar to Yup'ik are Menominee (10.5%, a difference of 32.2%), Tohono O'odham (9.3%, a difference of 49.6%), Inupiat (9.0%, a difference of 54.2%), Yakama (8.9%, a difference of 56.0%), and Hopi (8.1%, a difference of 71.6%).
| Demographics | Rating | Rank | Unemployment Among Ages 55 to 59 years |
| Pima | 0.0 /100 | #333 | Tragic 6.6% |
| Pueblo | 0.0 /100 | #334 | Tragic 6.7% |
| Colville | 0.0 /100 | #335 | Tragic 6.7% |
| Navajo | 0.0 /100 | #336 | Tragic 6.7% |
| Paiute | 0.0 /100 | #337 | Tragic 6.8% |
| Immigrants | Yemen | 0.0 /100 | #338 | Tragic 6.9% |
| Puerto Ricans | 0.0 /100 | #339 | Tragic 7.0% |
| Alaskan Athabascans | 0.0 /100 | #340 | Tragic 7.1% |
| Shoshone | 0.0 /100 | #341 | Tragic 7.4% |
| Hopi | 0.0 /100 | #342 | Tragic 8.1% |
| Yakama | 0.0 /100 | #343 | Tragic 8.9% |
| Inupiat | 0.0 /100 | #344 | Tragic 9.0% |
| Tohono O'odham | 0.0 /100 | #345 | Tragic 9.3% |
| Menominee | 0.0 /100 | #346 | Tragic 10.5% |
| Yup'ik | 0.0 /100 | #347 | Tragic 13.9% |
Demographics Similar to Immigrants from Hong Kong by Unemployment Among Ages 55 to 59 years
In terms of unemployment among ages 55 to 59 years, the demographic groups most similar to Immigrants from Hong Kong are Immigrants from Albania (5.0%, a difference of 0.11%), Choctaw (5.0%, a difference of 0.11%), Moroccan (5.0%, a difference of 0.14%), French American Indian (5.0%, a difference of 0.15%), and Immigrants from Southern Europe (5.0%, a difference of 0.23%).
| Demographics | Rating | Rank | Unemployment Among Ages 55 to 59 years |
| Immigrants | Liberia | 3.2 /100 | #228 | Tragic 5.0% |
| Immigrants | Western Asia | 3.0 /100 | #229 | Tragic 5.0% |
| Immigrants | Syria | 2.7 /100 | #230 | Tragic 5.0% |
| Cherokee | 2.6 /100 | #231 | Tragic 5.0% |
| Albanians | 2.5 /100 | #232 | Tragic 5.0% |
| Immigrants | Immigrants | 2.3 /100 | #233 | Tragic 5.0% |
| Immigrants | Southern Europe | 1.8 /100 | #234 | Tragic 5.0% |
| Immigrants | Hong Kong | 1.4 /100 | #235 | Tragic 5.0% |
| Immigrants | Albania | 1.3 /100 | #236 | Tragic 5.0% |
| Choctaw | 1.3 /100 | #237 | Tragic 5.0% |
| Moroccans | 1.3 /100 | #238 | Tragic 5.0% |
| French American Indians | 1.2 /100 | #239 | Tragic 5.0% |
| Immigrants | Costa Rica | 1.1 /100 | #240 | Tragic 5.0% |
| Brazilians | 1.0 /100 | #241 | Tragic 5.0% |
| Liberians | 0.9 /100 | #242 | Tragic 5.1% |