Crow vs Alaska Native Unemployment Among Ages 30 to 34 years
COMPARE
Crow
Alaska Native
Unemployment Among Ages 30 to 34 years
Unemployment Among Ages 30 to 34 years Comparison
Crow
Alaska Natives
10.3%
UNEMPLOYMENT AMONG AGES 30 TO 34 YEARS
0.0/ 100
METRIC RATING
340th/ 347
METRIC RANK
8.5%
UNEMPLOYMENT AMONG AGES 30 TO 34 YEARS
0.0/ 100
METRIC RATING
334th/ 347
METRIC RANK
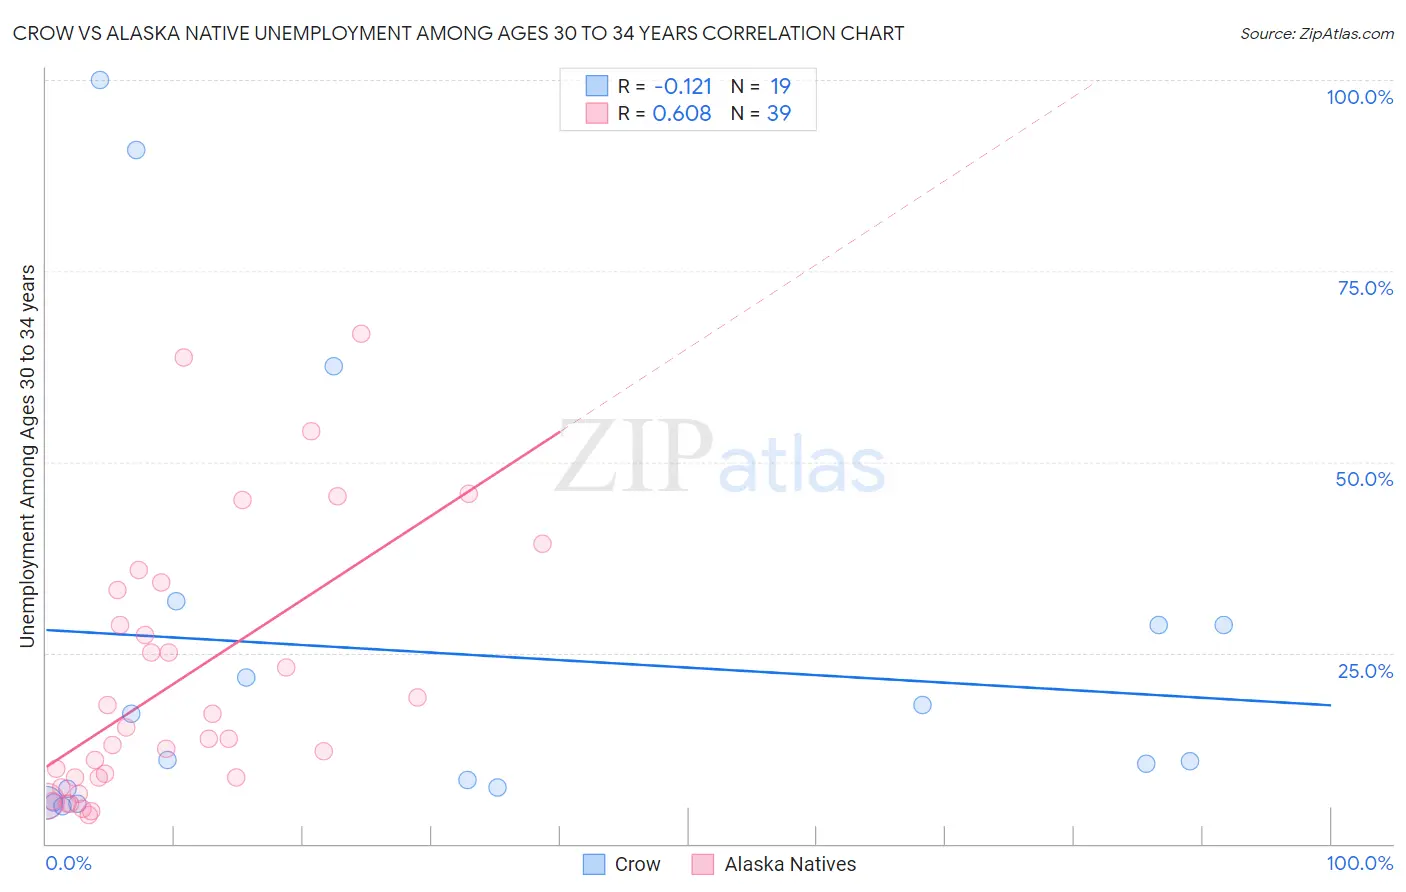
Crow vs Alaska Native Unemployment Among Ages 30 to 34 years Correlation Chart
The statistical analysis conducted on geographies consisting of 58,132,383 people shows a poor negative correlation between the proportion of Crow and unemployment rate among population between the ages 30 and 34 in the United States with a correlation coefficient (R) of -0.121 and weighted average of 10.3%. Similarly, the statistical analysis conducted on geographies consisting of 75,749,342 people shows a significant positive correlation between the proportion of Alaska Natives and unemployment rate among population between the ages 30 and 34 in the United States with a correlation coefficient (R) of 0.608 and weighted average of 8.5%, a difference of 21.8%.
Unemployment Among Ages 30 to 34 years Correlation Summary
| Measurement | Crow | Alaska Native |
| Minimum | 4.9% | 3.8% |
| Maximum | 100.0% | 66.7% |
| Range | 95.1% | 62.9% |
| Mean | 25.0% | 21.3% |
| Median | 10.9% | 13.8% |
| Interquartile 25% (IQ1) | 7.1% | 8.7% |
| Interquartile 75% (IQ3) | 28.6% | 33.3% |
| Interquartile Range (IQR) | 21.5% | 24.6% |
| Standard Deviation (Sample) | 28.5% | 17.2% |
| Standard Deviation (Population) | 27.8% | 16.9% |
Demographics Similar to Crow and Alaska Natives by Unemployment Among Ages 30 to 34 years
In terms of unemployment among ages 30 to 34 years, the demographic groups most similar to Crow are Navajo (10.6%, a difference of 2.0%), Yuman (10.6%, a difference of 2.4%), Inupiat (10.8%, a difference of 4.6%), Tohono O'odham (9.8%, a difference of 5.2%), and Yakama (9.8%, a difference of 6.0%). Similarly, the demographic groups most similar to Alaska Natives are Pueblo (8.3%, a difference of 2.7%), Native/Alaskan (8.2%, a difference of 3.1%), Puerto Rican (8.9%, a difference of 4.5%), Sioux (8.0%, a difference of 5.8%), and Colville (9.0%, a difference of 6.5%).
| Demographics | Rating | Rank | Unemployment Among Ages 30 to 34 years |
| Immigrants | Dominican Republic | 0.0 /100 | #327 | Tragic 7.7% |
| Chippewa | 0.0 /100 | #328 | Tragic 7.8% |
| Cheyenne | 0.0 /100 | #329 | Tragic 7.8% |
| Shoshone | 0.0 /100 | #330 | Tragic 7.9% |
| Sioux | 0.0 /100 | #331 | Tragic 8.0% |
| Natives/Alaskans | 0.0 /100 | #332 | Tragic 8.2% |
| Pueblo | 0.0 /100 | #333 | Tragic 8.3% |
| Alaska Natives | 0.0 /100 | #334 | Tragic 8.5% |
| Puerto Ricans | 0.0 /100 | #335 | Tragic 8.9% |
| Colville | 0.0 /100 | #336 | Tragic 9.0% |
| Pima | 0.0 /100 | #337 | Tragic 9.6% |
| Yakama | 0.0 /100 | #338 | Tragic 9.8% |
| Tohono O'odham | 0.0 /100 | #339 | Tragic 9.8% |
| Crow | 0.0 /100 | #340 | Tragic 10.3% |
| Navajo | 0.0 /100 | #341 | Tragic 10.6% |
| Yuman | 0.0 /100 | #342 | Tragic 10.6% |
| Inupiat | 0.0 /100 | #343 | Tragic 10.8% |
| Hopi | 0.0 /100 | #344 | Tragic 11.9% |
| Arapaho | 0.0 /100 | #345 | Tragic 12.8% |
| Tsimshian | 0.0 /100 | #346 | Tragic 13.8% |
| Yup'ik | 0.0 /100 | #347 | Tragic 18.5% |