Immigrants from Korea vs British Unemployment
COMPARE
Immigrants from Korea
British
Unemployment
Unemployment Comparison
Immigrants from Korea
British
5.0%
UNEMPLOYMENT
96.6/ 100
METRIC RATING
88th/ 347
METRIC RANK
4.7%
UNEMPLOYMENT
99.9/ 100
METRIC RATING
23rd/ 347
METRIC RANK
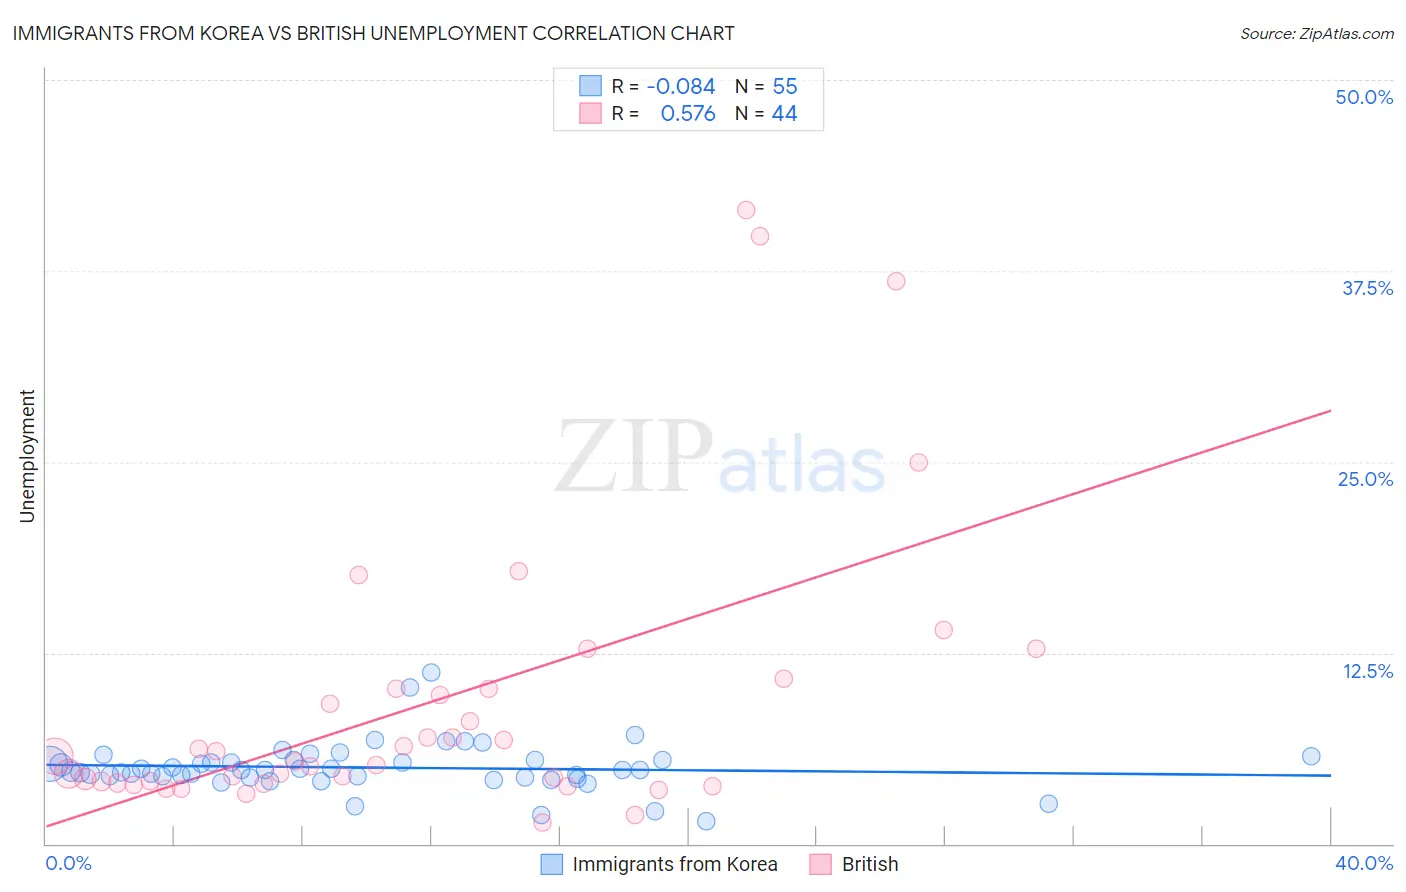
Immigrants from Korea vs British Unemployment Correlation Chart
The statistical analysis conducted on geographies consisting of 415,935,417 people shows a slight negative correlation between the proportion of Immigrants from Korea and unemployment in the United States with a correlation coefficient (R) of -0.084 and weighted average of 5.0%. Similarly, the statistical analysis conducted on geographies consisting of 529,433,741 people shows a substantial positive correlation between the proportion of British and unemployment in the United States with a correlation coefficient (R) of 0.576 and weighted average of 4.7%, a difference of 6.0%.
Unemployment Correlation Summary
| Measurement | Immigrants from Korea | British |
| Minimum | 1.5% | 1.4% |
| Maximum | 11.2% | 41.5% |
| Range | 9.7% | 40.1% |
| Mean | 5.0% | 9.3% |
| Median | 4.8% | 5.6% |
| Interquartile 25% (IQ1) | 4.3% | 4.0% |
| Interquartile 75% (IQ3) | 5.5% | 10.1% |
| Interquartile Range (IQR) | 1.2% | 6.1% |
| Standard Deviation (Sample) | 1.6% | 9.5% |
| Standard Deviation (Population) | 1.6% | 9.4% |
Similar Demographics by Unemployment
Demographics Similar to Immigrants from Korea by Unemployment
In terms of unemployment, the demographic groups most similar to Immigrants from Korea are Immigrants from Moldova (5.0%, a difference of 0.030%), Jordanian (5.0%, a difference of 0.090%), Immigrants from North Macedonia (5.0%, a difference of 0.13%), Immigrants from Sudan (5.0%, a difference of 0.14%), and Immigrants from South Africa (5.0%, a difference of 0.16%).
| Demographics | Rating | Rank | Unemployment |
| Basques | 97.6 /100 | #81 | Exceptional 5.0% |
| Fijians | 97.6 /100 | #82 | Exceptional 5.0% |
| Hmong | 97.6 /100 | #83 | Exceptional 5.0% |
| Russians | 97.4 /100 | #84 | Exceptional 5.0% |
| Immigrants | Australia | 97.0 /100 | #85 | Exceptional 5.0% |
| Hungarians | 96.9 /100 | #86 | Exceptional 5.0% |
| Immigrants | Moldova | 96.6 /100 | #87 | Exceptional 5.0% |
| Immigrants | Korea | 96.6 /100 | #88 | Exceptional 5.0% |
| Jordanians | 96.4 /100 | #89 | Exceptional 5.0% |
| Immigrants | North Macedonia | 96.3 /100 | #90 | Exceptional 5.0% |
| Immigrants | Sudan | 96.3 /100 | #91 | Exceptional 5.0% |
| Immigrants | South Africa | 96.2 /100 | #92 | Exceptional 5.0% |
| Ukrainians | 96.0 /100 | #93 | Exceptional 5.0% |
| Immigrants | Austria | 95.9 /100 | #94 | Exceptional 5.0% |
| Immigrants | Serbia | 95.6 /100 | #95 | Exceptional 5.0% |
Demographics Similar to British by Unemployment
In terms of unemployment, the demographic groups most similar to British are Venezuelan (4.7%, a difference of 0.080%), Latvian (4.7%, a difference of 0.15%), Bulgarian (4.7%, a difference of 0.19%), Welsh (4.7%, a difference of 0.30%), and Thai (4.7%, a difference of 0.30%).
| Demographics | Rating | Rank | Unemployment |
| Chinese | 99.9 /100 | #16 | Exceptional 4.7% |
| Slovenes | 99.9 /100 | #17 | Exceptional 4.7% |
| Immigrants | Venezuela | 99.9 /100 | #18 | Exceptional 4.7% |
| Scottish | 99.9 /100 | #19 | Exceptional 4.7% |
| Carpatho Rusyns | 99.9 /100 | #20 | Exceptional 4.7% |
| Welsh | 99.9 /100 | #21 | Exceptional 4.7% |
| Thais | 99.9 /100 | #22 | Exceptional 4.7% |
| British | 99.9 /100 | #23 | Exceptional 4.7% |
| Venezuelans | 99.9 /100 | #24 | Exceptional 4.7% |
| Latvians | 99.9 /100 | #25 | Exceptional 4.7% |
| Bulgarians | 99.9 /100 | #26 | Exceptional 4.7% |
| Finns | 99.9 /100 | #27 | Exceptional 4.7% |
| Cubans | 99.8 /100 | #28 | Exceptional 4.7% |
| Poles | 99.8 /100 | #29 | Exceptional 4.7% |
| Irish | 99.8 /100 | #30 | Exceptional 4.8% |