Immigrants from Korea vs Immigrants from Ecuador Unemployment Among Women with Children Under 6 years
COMPARE
Immigrants from Korea
Immigrants from Ecuador
Unemployment Among Women with Children Under 6 years
Unemployment Among Women with Children Under 6 years Comparison
Immigrants from Korea
Immigrants from Ecuador
6.5%
UNEMPLOYMENT AMONG WOMEN WITH CHILDREN UNDER 6 YEARS
100.0/ 100
METRIC RATING
22nd/ 347
METRIC RANK
7.9%
UNEMPLOYMENT AMONG WOMEN WITH CHILDREN UNDER 6 YEARS
14.9/ 100
METRIC RATING
211th/ 347
METRIC RANK
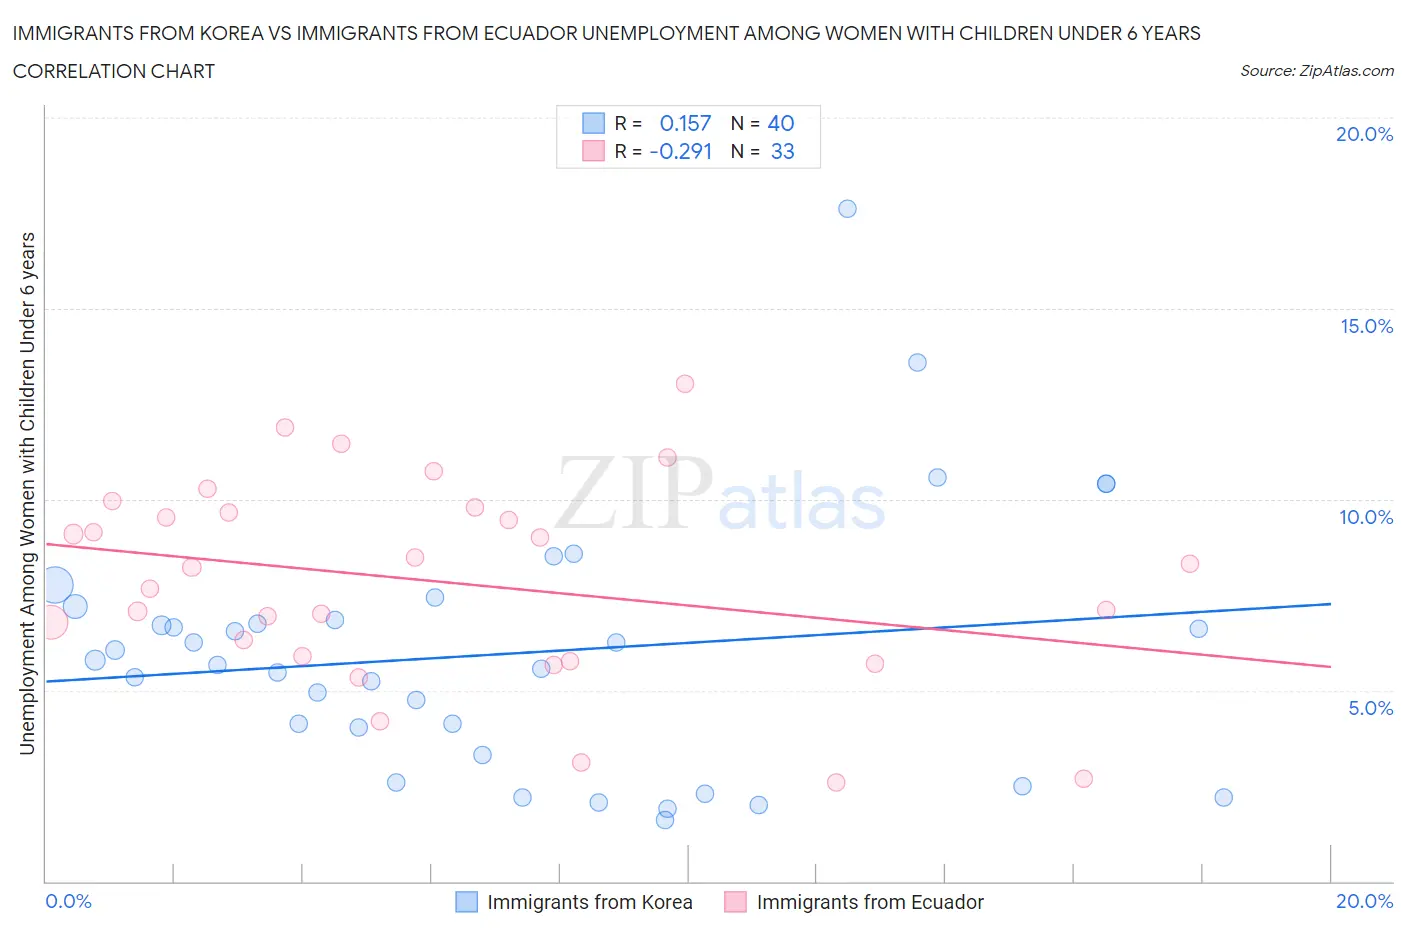
Immigrants from Korea vs Immigrants from Ecuador Unemployment Among Women with Children Under 6 years Correlation Chart
The statistical analysis conducted on geographies consisting of 313,093,408 people shows a poor positive correlation between the proportion of Immigrants from Korea and unemployment rate among women with children under the age of 6 in the United States with a correlation coefficient (R) of 0.157 and weighted average of 6.5%. Similarly, the statistical analysis conducted on geographies consisting of 223,112,297 people shows a weak negative correlation between the proportion of Immigrants from Ecuador and unemployment rate among women with children under the age of 6 in the United States with a correlation coefficient (R) of -0.291 and weighted average of 7.9%, a difference of 20.9%.
Unemployment Among Women with Children Under 6 years Correlation Summary
| Measurement | Immigrants from Korea | Immigrants from Ecuador |
| Minimum | 1.6% | 2.6% |
| Maximum | 17.6% | 13.0% |
| Range | 16.0% | 10.4% |
| Mean | 6.0% | 7.8% |
| Median | 5.7% | 8.2% |
| Interquartile 25% (IQ1) | 3.7% | 5.8% |
| Interquartile 75% (IQ3) | 7.0% | 9.7% |
| Interquartile Range (IQR) | 3.3% | 3.9% |
| Standard Deviation (Sample) | 3.3% | 2.6% |
| Standard Deviation (Population) | 3.3% | 2.6% |
Similar Demographics by Unemployment Among Women with Children Under 6 years
Demographics Similar to Immigrants from Korea by Unemployment Among Women with Children Under 6 years
In terms of unemployment among women with children under 6 years, the demographic groups most similar to Immigrants from Korea are Bulgarian (6.5%, a difference of 0.20%), Laotian (6.5%, a difference of 0.34%), Soviet Union (6.5%, a difference of 0.36%), Burmese (6.5%, a difference of 0.42%), and Cypriot (6.5%, a difference of 0.45%).
| Demographics | Rating | Rank | Unemployment Among Women with Children Under 6 years |
| Thais | 100.0 /100 | #15 | Exceptional 6.3% |
| Immigrants | Uzbekistan | 100.0 /100 | #16 | Exceptional 6.3% |
| Immigrants | Malaysia | 100.0 /100 | #17 | Exceptional 6.4% |
| Assyrians/Chaldeans/Syriacs | 100.0 /100 | #18 | Exceptional 6.5% |
| Mongolians | 100.0 /100 | #19 | Exceptional 6.5% |
| Ute | 100.0 /100 | #20 | Exceptional 6.5% |
| Burmese | 100.0 /100 | #21 | Exceptional 6.5% |
| Immigrants | Korea | 100.0 /100 | #22 | Exceptional 6.5% |
| Bulgarians | 100.0 /100 | #23 | Exceptional 6.5% |
| Laotians | 100.0 /100 | #24 | Exceptional 6.5% |
| Soviet Union | 100.0 /100 | #25 | Exceptional 6.5% |
| Cypriots | 100.0 /100 | #26 | Exceptional 6.5% |
| Immigrants | Japan | 100.0 /100 | #27 | Exceptional 6.5% |
| Immigrants | Israel | 100.0 /100 | #28 | Exceptional 6.5% |
| Immigrants | Sweden | 100.0 /100 | #29 | Exceptional 6.6% |
Demographics Similar to Immigrants from Ecuador by Unemployment Among Women with Children Under 6 years
In terms of unemployment among women with children under 6 years, the demographic groups most similar to Immigrants from Ecuador are Polish (7.9%, a difference of 0.13%), Costa Rican (7.8%, a difference of 0.31%), Swiss (7.9%, a difference of 0.37%), Immigrants from Syria (7.8%, a difference of 0.45%), and Scottish (7.9%, a difference of 0.50%).
| Demographics | Rating | Rank | Unemployment Among Women with Children Under 6 years |
| Lebanese | 22.2 /100 | #204 | Fair 7.8% |
| Immigrants | Immigrants | 21.4 /100 | #205 | Fair 7.8% |
| Hungarians | 21.2 /100 | #206 | Fair 7.8% |
| Canadians | 20.6 /100 | #207 | Fair 7.8% |
| Immigrants | Syria | 18.9 /100 | #208 | Poor 7.8% |
| Costa Ricans | 17.6 /100 | #209 | Poor 7.8% |
| Poles | 16.0 /100 | #210 | Poor 7.9% |
| Immigrants | Ecuador | 14.9 /100 | #211 | Poor 7.9% |
| Swiss | 12.3 /100 | #212 | Poor 7.9% |
| Scottish | 11.4 /100 | #213 | Poor 7.9% |
| Spanish | 11.3 /100 | #214 | Poor 7.9% |
| Ecuadorians | 11.2 /100 | #215 | Poor 7.9% |
| Immigrants | Lebanon | 11.1 /100 | #216 | Poor 7.9% |
| Immigrants | Nigeria | 10.3 /100 | #217 | Poor 7.9% |
| Moroccans | 9.7 /100 | #218 | Tragic 7.9% |