British West Indian vs Immigrants from the Azores Unemployment Among Women with Children Under 6 years
COMPARE
British West Indian
Immigrants from the Azores
Unemployment Among Women with Children Under 6 years
Unemployment Among Women with Children Under 6 years Comparison
British West Indians
Immigrants from the Azores
8.3%
UNEMPLOYMENT AMONG WOMEN WITH CHILDREN UNDER 6 YEARS
0.5/ 100
METRIC RATING
257th/ 347
METRIC RANK
9.2%
UNEMPLOYMENT AMONG WOMEN WITH CHILDREN UNDER 6 YEARS
0.0/ 100
METRIC RATING
312th/ 347
METRIC RANK
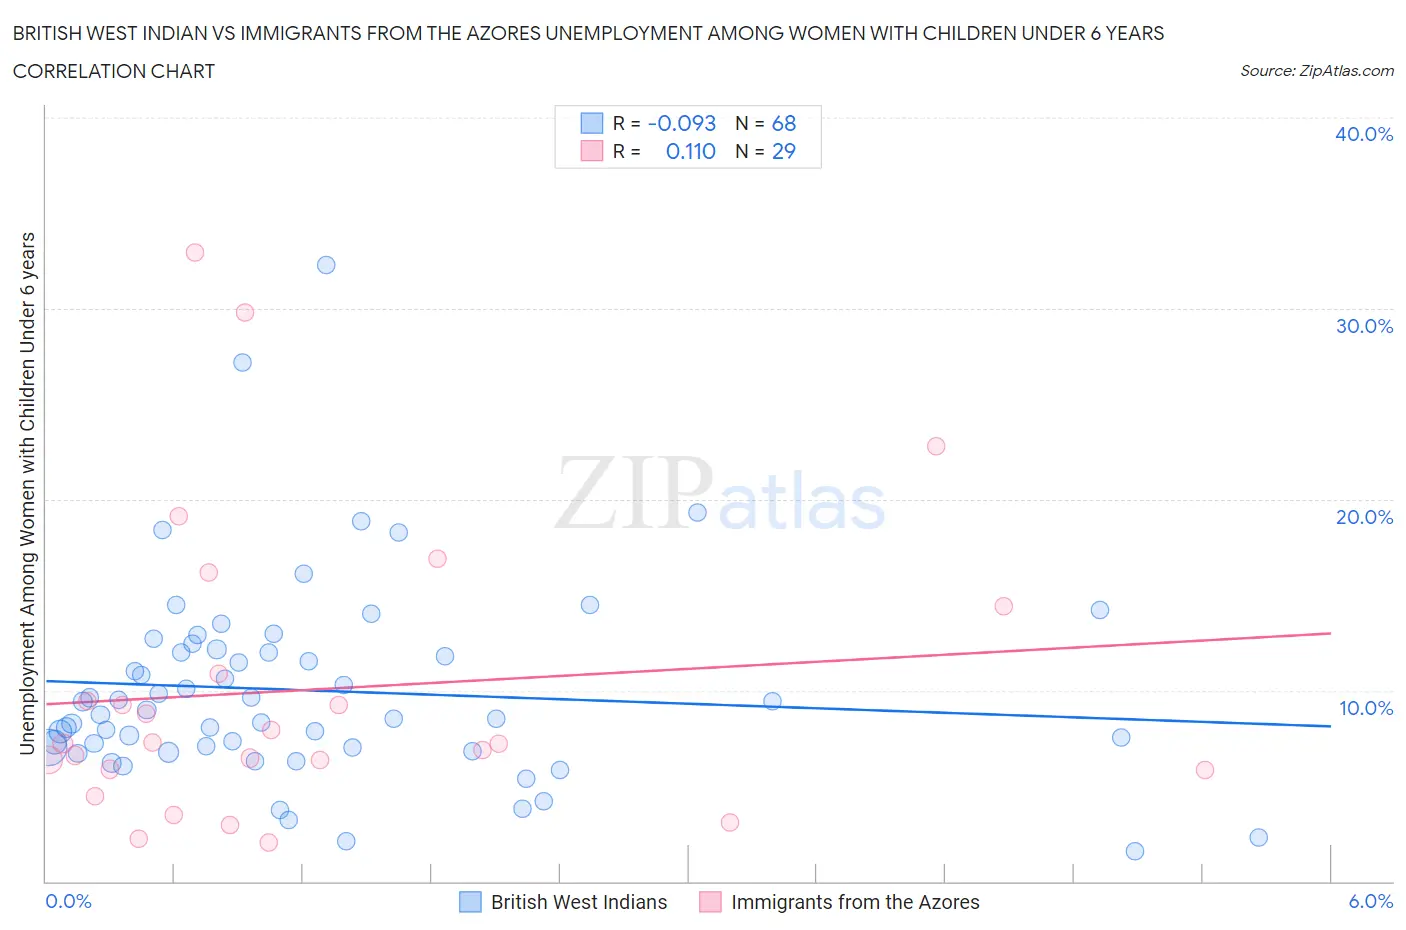
British West Indian vs Immigrants from the Azores Unemployment Among Women with Children Under 6 years Correlation Chart
The statistical analysis conducted on geographies consisting of 134,064,740 people shows a slight negative correlation between the proportion of British West Indians and unemployment rate among women with children under the age of 6 in the United States with a correlation coefficient (R) of -0.093 and weighted average of 8.3%. Similarly, the statistical analysis conducted on geographies consisting of 40,648,611 people shows a poor positive correlation between the proportion of Immigrants from the Azores and unemployment rate among women with children under the age of 6 in the United States with a correlation coefficient (R) of 0.110 and weighted average of 9.2%, a difference of 10.8%.
Unemployment Among Women with Children Under 6 years Correlation Summary
| Measurement | British West Indian | Immigrants from the Azores |
| Minimum | 1.6% | 2.0% |
| Maximum | 32.3% | 32.9% |
| Range | 30.7% | 30.9% |
| Mean | 10.0% | 10.1% |
| Median | 8.8% | 7.2% |
| Interquartile 25% (IQ1) | 7.0% | 5.8% |
| Interquartile 75% (IQ3) | 12.1% | 12.6% |
| Interquartile Range (IQR) | 5.1% | 6.8% |
| Standard Deviation (Sample) | 5.3% | 7.8% |
| Standard Deviation (Population) | 5.2% | 7.6% |
Similar Demographics by Unemployment Among Women with Children Under 6 years
Demographics Similar to British West Indians by Unemployment Among Women with Children Under 6 years
In terms of unemployment among women with children under 6 years, the demographic groups most similar to British West Indians are Immigrants from Ghana (8.3%, a difference of 0.020%), Celtic (8.3%, a difference of 0.26%), Immigrants from Portugal (8.3%, a difference of 0.27%), Barbadian (8.3%, a difference of 0.31%), and Immigrants from Caribbean (8.3%, a difference of 0.57%).
| Demographics | Rating | Rank | Unemployment Among Women with Children Under 6 years |
| Nigerians | 1.1 /100 | #250 | Tragic 8.2% |
| Guyanese | 1.0 /100 | #251 | Tragic 8.2% |
| Ghanaians | 1.0 /100 | #252 | Tragic 8.2% |
| Immigrants | Guyana | 0.8 /100 | #253 | Tragic 8.2% |
| Immigrants | Caribbean | 0.7 /100 | #254 | Tragic 8.3% |
| Immigrants | Portugal | 0.6 /100 | #255 | Tragic 8.3% |
| Celtics | 0.6 /100 | #256 | Tragic 8.3% |
| British West Indians | 0.5 /100 | #257 | Tragic 8.3% |
| Immigrants | Ghana | 0.5 /100 | #258 | Tragic 8.3% |
| Barbadians | 0.4 /100 | #259 | Tragic 8.3% |
| Whites/Caucasians | 0.3 /100 | #260 | Tragic 8.4% |
| Immigrants | Liberia | 0.3 /100 | #261 | Tragic 8.4% |
| West Indians | 0.3 /100 | #262 | Tragic 8.4% |
| Scotch-Irish | 0.3 /100 | #263 | Tragic 8.4% |
| Hondurans | 0.3 /100 | #264 | Tragic 8.4% |
Demographics Similar to Immigrants from the Azores by Unemployment Among Women with Children Under 6 years
In terms of unemployment among women with children under 6 years, the demographic groups most similar to Immigrants from the Azores are French American Indian (9.2%, a difference of 0.14%), Cajun (9.2%, a difference of 0.42%), American (9.3%, a difference of 0.44%), Fijian (9.3%, a difference of 0.46%), and African (9.2%, a difference of 0.55%).
| Demographics | Rating | Rank | Unemployment Among Women with Children Under 6 years |
| Alaskan Athabascans | 0.0 /100 | #305 | Tragic 9.1% |
| Pueblo | 0.0 /100 | #306 | Tragic 9.1% |
| Dominicans | 0.0 /100 | #307 | Tragic 9.1% |
| Immigrants | Micronesia | 0.0 /100 | #308 | Tragic 9.1% |
| Africans | 0.0 /100 | #309 | Tragic 9.2% |
| Cajuns | 0.0 /100 | #310 | Tragic 9.2% |
| French American Indians | 0.0 /100 | #311 | Tragic 9.2% |
| Immigrants | Azores | 0.0 /100 | #312 | Tragic 9.2% |
| Americans | 0.0 /100 | #313 | Tragic 9.3% |
| Fijians | 0.0 /100 | #314 | Tragic 9.3% |
| Cherokee | 0.0 /100 | #315 | Tragic 9.3% |
| Houma | 0.0 /100 | #316 | Tragic 9.4% |
| Dutch West Indians | 0.0 /100 | #317 | Tragic 9.5% |
| Osage | 0.0 /100 | #318 | Tragic 9.5% |
| Marshallese | 0.0 /100 | #319 | Tragic 9.6% |