Immigrants from Kenya vs Immigrants from North Macedonia Unemployment Among Women with Children Under 6 years
COMPARE
Immigrants from Kenya
Immigrants from North Macedonia
Unemployment Among Women with Children Under 6 years
Unemployment Among Women with Children Under 6 years Comparison
Immigrants from Kenya
Immigrants from North Macedonia
7.3%
UNEMPLOYMENT AMONG WOMEN WITH CHILDREN UNDER 6 YEARS
95.4/ 100
METRIC RATING
117th/ 347
METRIC RANK
7.7%
UNEMPLOYMENT AMONG WOMEN WITH CHILDREN UNDER 6 YEARS
34.4/ 100
METRIC RATING
190th/ 347
METRIC RANK
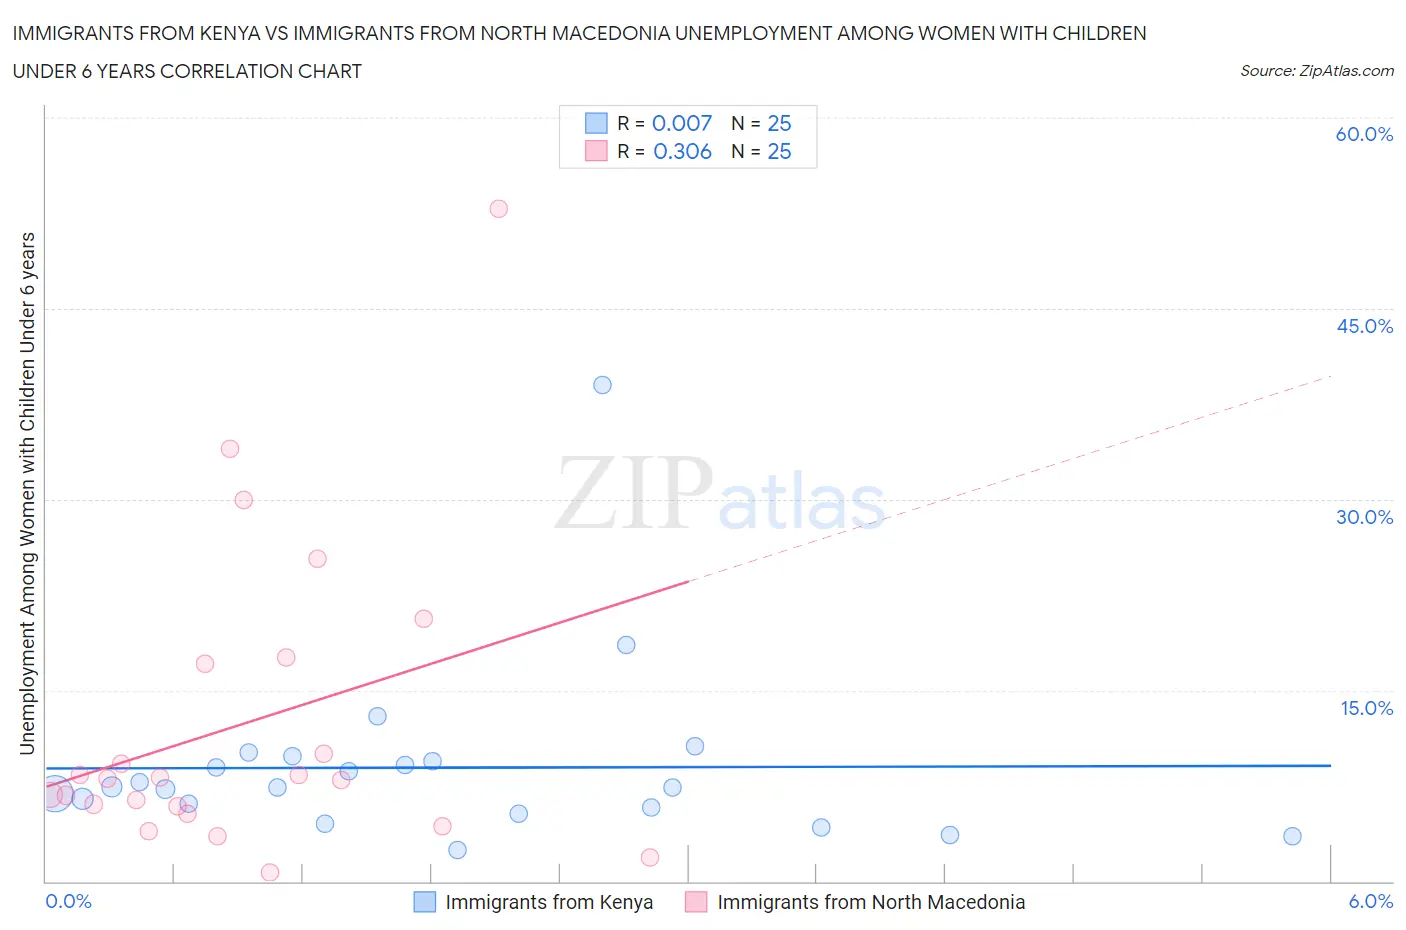
Immigrants from Kenya vs Immigrants from North Macedonia Unemployment Among Women with Children Under 6 years Correlation Chart
The statistical analysis conducted on geographies consisting of 185,437,277 people shows no correlation between the proportion of Immigrants from Kenya and unemployment rate among women with children under the age of 6 in the United States with a correlation coefficient (R) of 0.007 and weighted average of 7.3%. Similarly, the statistical analysis conducted on geographies consisting of 65,526,409 people shows a mild positive correlation between the proportion of Immigrants from North Macedonia and unemployment rate among women with children under the age of 6 in the United States with a correlation coefficient (R) of 0.306 and weighted average of 7.7%, a difference of 6.4%.
Unemployment Among Women with Children Under 6 years Correlation Summary
| Measurement | Immigrants from Kenya | Immigrants from North Macedonia |
| Minimum | 2.4% | 0.70% |
| Maximum | 39.0% | 52.8% |
| Range | 36.6% | 52.1% |
| Mean | 8.9% | 12.4% |
| Median | 7.4% | 8.0% |
| Interquartile 25% (IQ1) | 5.5% | 5.6% |
| Interquartile 75% (IQ3) | 9.6% | 17.3% |
| Interquartile Range (IQR) | 4.1% | 11.7% |
| Standard Deviation (Sample) | 7.1% | 12.1% |
| Standard Deviation (Population) | 7.0% | 11.8% |
Similar Demographics by Unemployment Among Women with Children Under 6 years
Demographics Similar to Immigrants from Kenya by Unemployment Among Women with Children Under 6 years
In terms of unemployment among women with children under 6 years, the demographic groups most similar to Immigrants from Kenya are Armenian (7.2%, a difference of 0.21%), Immigrants from Italy (7.2%, a difference of 0.30%), Serbian (7.3%, a difference of 0.33%), Argentinean (7.2%, a difference of 0.38%), and Nicaraguan (7.2%, a difference of 0.42%).
| Demographics | Rating | Rank | Unemployment Among Women with Children Under 6 years |
| Palestinians | 96.8 /100 | #110 | Exceptional 7.2% |
| Norwegians | 96.7 /100 | #111 | Exceptional 7.2% |
| Israelis | 96.5 /100 | #112 | Exceptional 7.2% |
| Nicaraguans | 96.3 /100 | #113 | Exceptional 7.2% |
| Argentineans | 96.2 /100 | #114 | Exceptional 7.2% |
| Immigrants | Italy | 96.1 /100 | #115 | Exceptional 7.2% |
| Armenians | 95.9 /100 | #116 | Exceptional 7.2% |
| Immigrants | Kenya | 95.4 /100 | #117 | Exceptional 7.3% |
| Serbians | 94.5 /100 | #118 | Exceptional 7.3% |
| South Africans | 94.1 /100 | #119 | Exceptional 7.3% |
| Iraqis | 93.9 /100 | #120 | Exceptional 7.3% |
| Immigrants | Chile | 93.5 /100 | #121 | Exceptional 7.3% |
| Immigrants | Bosnia and Herzegovina | 93.5 /100 | #122 | Exceptional 7.3% |
| Immigrants | Zaire | 93.3 /100 | #123 | Exceptional 7.3% |
| Immigrants | South Africa | 92.5 /100 | #124 | Exceptional 7.3% |
Demographics Similar to Immigrants from North Macedonia by Unemployment Among Women with Children Under 6 years
In terms of unemployment among women with children under 6 years, the demographic groups most similar to Immigrants from North Macedonia are Immigrants from Panama (7.7%, a difference of 0.090%), Immigrants from Austria (7.7%, a difference of 0.15%), Immigrants from Africa (7.7%, a difference of 0.15%), Slavic (7.7%, a difference of 0.15%), and Syrian (7.7%, a difference of 0.19%).
| Demographics | Rating | Rank | Unemployment Among Women with Children Under 6 years |
| Sierra Leoneans | 42.9 /100 | #183 | Average 7.7% |
| Indonesians | 40.5 /100 | #184 | Average 7.7% |
| Spanish Americans | 39.7 /100 | #185 | Fair 7.7% |
| Yugoslavians | 39.4 /100 | #186 | Fair 7.7% |
| Immigrants | Thailand | 38.5 /100 | #187 | Fair 7.7% |
| Czechoslovakians | 38.4 /100 | #188 | Fair 7.7% |
| Immigrants | Panama | 35.7 /100 | #189 | Fair 7.7% |
| Immigrants | North Macedonia | 34.4 /100 | #190 | Fair 7.7% |
| Immigrants | Austria | 32.4 /100 | #191 | Fair 7.7% |
| Immigrants | Africa | 32.4 /100 | #192 | Fair 7.7% |
| Slavs | 32.4 /100 | #193 | Fair 7.7% |
| Syrians | 31.9 /100 | #194 | Fair 7.7% |
| Malaysians | 31.1 /100 | #195 | Fair 7.7% |
| Immigrants | St. Vincent and the Grenadines | 31.1 /100 | #196 | Fair 7.7% |
| Italians | 30.4 /100 | #197 | Fair 7.7% |