Immigrants from Japan vs Immigrants from Philippines Unemployment Among Women with Children Under 6 years
COMPARE
Immigrants from Japan
Immigrants from Philippines
Unemployment Among Women with Children Under 6 years
Unemployment Among Women with Children Under 6 years Comparison
Immigrants from Japan
Immigrants from Philippines
6.5%
UNEMPLOYMENT AMONG WOMEN WITH CHILDREN UNDER 6 YEARS
100.0/ 100
METRIC RATING
27th/ 347
METRIC RANK
7.5%
UNEMPLOYMENT AMONG WOMEN WITH CHILDREN UNDER 6 YEARS
71.3/ 100
METRIC RATING
159th/ 347
METRIC RANK
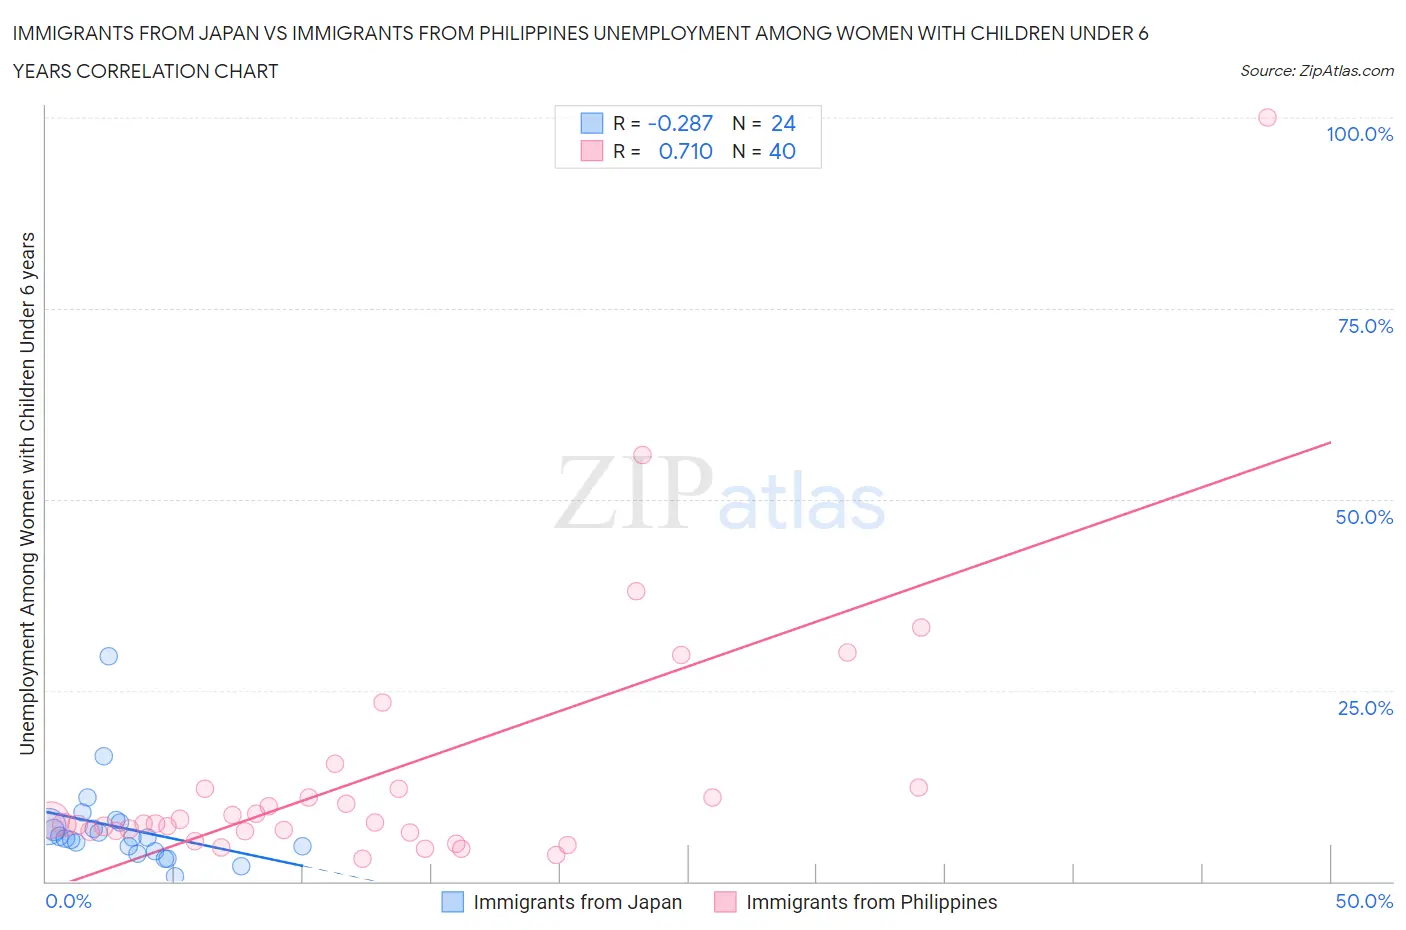
Immigrants from Japan vs Immigrants from Philippines Unemployment Among Women with Children Under 6 years Correlation Chart
The statistical analysis conducted on geographies consisting of 268,694,372 people shows a weak negative correlation between the proportion of Immigrants from Japan and unemployment rate among women with children under the age of 6 in the United States with a correlation coefficient (R) of -0.287 and weighted average of 6.5%. Similarly, the statistical analysis conducted on geographies consisting of 343,754,489 people shows a strong positive correlation between the proportion of Immigrants from Philippines and unemployment rate among women with children under the age of 6 in the United States with a correlation coefficient (R) of 0.710 and weighted average of 7.5%, a difference of 15.1%.
Unemployment Among Women with Children Under 6 years Correlation Summary
| Measurement | Immigrants from Japan | Immigrants from Philippines |
| Minimum | 0.70% | 3.0% |
| Maximum | 29.5% | 100.0% |
| Range | 28.8% | 97.0% |
| Mean | 7.0% | 14.1% |
| Median | 5.7% | 7.6% |
| Interquartile 25% (IQ1) | 4.3% | 6.5% |
| Interquartile 75% (IQ3) | 7.4% | 12.1% |
| Interquartile Range (IQR) | 3.2% | 5.5% |
| Standard Deviation (Sample) | 5.7% | 17.7% |
| Standard Deviation (Population) | 5.6% | 17.5% |
Similar Demographics by Unemployment Among Women with Children Under 6 years
Demographics Similar to Immigrants from Japan by Unemployment Among Women with Children Under 6 years
In terms of unemployment among women with children under 6 years, the demographic groups most similar to Immigrants from Japan are Immigrants from Israel (6.5%, a difference of 0.020%), Cypriot (6.5%, a difference of 0.10%), Soviet Union (6.5%, a difference of 0.18%), Laotian (6.5%, a difference of 0.20%), and Immigrants from Sweden (6.6%, a difference of 0.28%).
| Demographics | Rating | Rank | Unemployment Among Women with Children Under 6 years |
| Ute | 100.0 /100 | #20 | Exceptional 6.5% |
| Burmese | 100.0 /100 | #21 | Exceptional 6.5% |
| Immigrants | Korea | 100.0 /100 | #22 | Exceptional 6.5% |
| Bulgarians | 100.0 /100 | #23 | Exceptional 6.5% |
| Laotians | 100.0 /100 | #24 | Exceptional 6.5% |
| Soviet Union | 100.0 /100 | #25 | Exceptional 6.5% |
| Cypriots | 100.0 /100 | #26 | Exceptional 6.5% |
| Immigrants | Japan | 100.0 /100 | #27 | Exceptional 6.5% |
| Immigrants | Israel | 100.0 /100 | #28 | Exceptional 6.5% |
| Immigrants | Sweden | 100.0 /100 | #29 | Exceptional 6.6% |
| Immigrants | Belarus | 100.0 /100 | #30 | Exceptional 6.6% |
| Immigrants | Moldova | 100.0 /100 | #31 | Exceptional 6.6% |
| Tsimshian | 100.0 /100 | #32 | Exceptional 6.6% |
| Immigrants | Vietnam | 100.0 /100 | #33 | Exceptional 6.6% |
| Immigrants | South Central Asia | 100.0 /100 | #34 | Exceptional 6.6% |
Demographics Similar to Immigrants from Philippines by Unemployment Among Women with Children Under 6 years
In terms of unemployment among women with children under 6 years, the demographic groups most similar to Immigrants from Philippines are Bolivian (7.5%, a difference of 0.040%), Croatian (7.5%, a difference of 0.050%), Peruvian (7.5%, a difference of 0.080%), Immigrants from Western Asia (7.5%, a difference of 0.080%), and Immigrants from Southern Europe (7.5%, a difference of 0.17%).
| Demographics | Rating | Rank | Unemployment Among Women with Children Under 6 years |
| Bangladeshis | 74.8 /100 | #152 | Good 7.5% |
| Uruguayans | 74.7 /100 | #153 | Good 7.5% |
| Northern Europeans | 74.3 /100 | #154 | Good 7.5% |
| South Americans | 74.1 /100 | #155 | Good 7.5% |
| Immigrants | Southern Europe | 73.2 /100 | #156 | Good 7.5% |
| Peruvians | 72.3 /100 | #157 | Good 7.5% |
| Croatians | 71.9 /100 | #158 | Good 7.5% |
| Immigrants | Philippines | 71.3 /100 | #159 | Good 7.5% |
| Bolivians | 70.8 /100 | #160 | Good 7.5% |
| Immigrants | Western Asia | 70.2 /100 | #161 | Good 7.5% |
| Immigrants | Lithuania | 68.8 /100 | #162 | Good 7.5% |
| British | 66.3 /100 | #163 | Good 7.6% |
| Ugandans | 65.8 /100 | #164 | Good 7.6% |
| Immigrants | South America | 65.6 /100 | #165 | Good 7.6% |
| Belgians | 63.5 /100 | #166 | Good 7.6% |